Anil Niraula
.jpg?raw=true)
LinkedIn Profile | GitHub Projects
Data Scientist/Analyst with 8+ years of hands-on experience using Python | PyTorch | TensorFlow | R | Azure AI | SQL | SAS | Shell | Snowflake | Tableau | Git | Jira | MS Office for data science, machine learning & AI (traning, validation and deployment), analytics, applied research, data prep & database management (ETL flow), developing R packages & interactive apps.
Career interests in data science, ML, analytics, and personal finance.
Portfolio
Data Science/Machine Learning
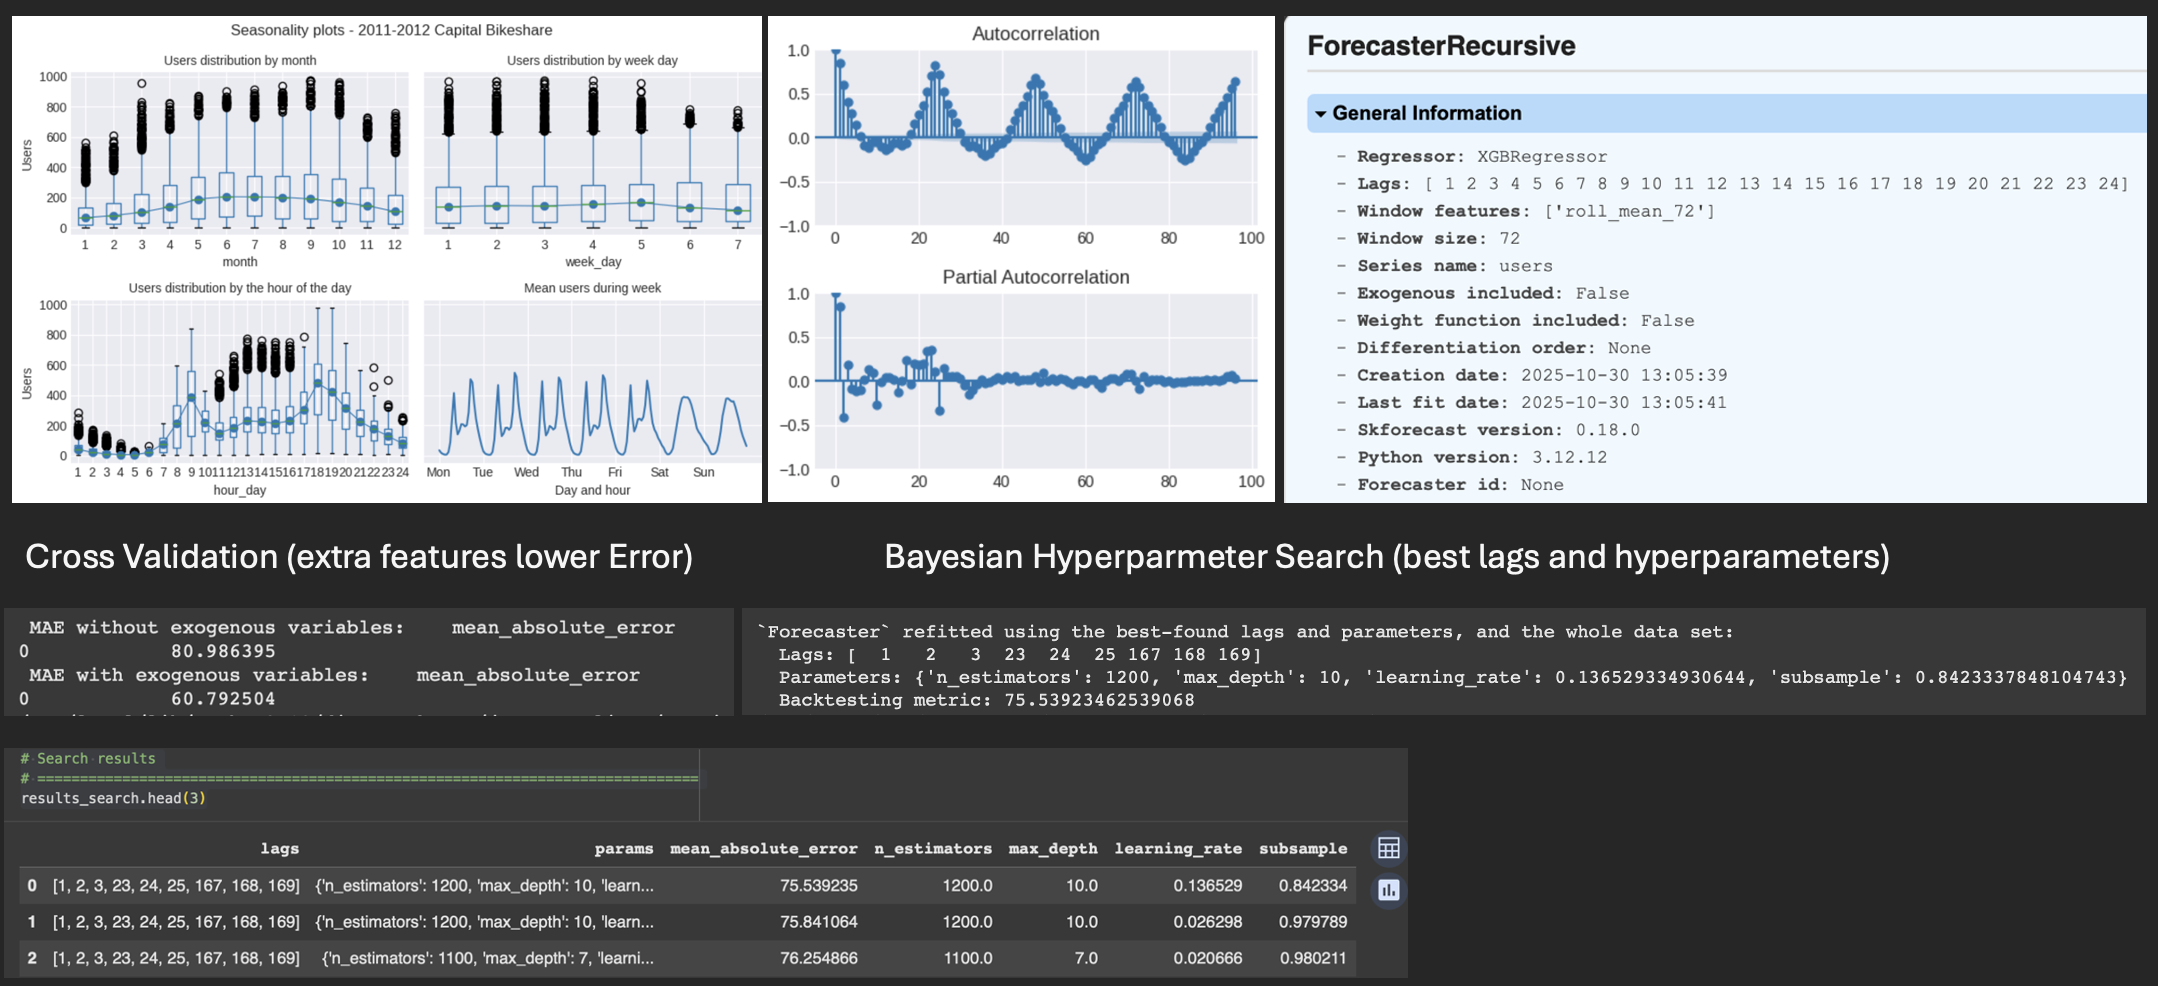
Predicting Bike Rentals - Time Series (via Python skforecast & statsmodels)
–Time Sereis forecasting of Bike Share hourly data via Python (XGBRegressor, skforecast, sklearn, statsmodels). Visualizing seasonality and autocorrelation patterns,fitting XGBRegressor model with and without rolling 3-day average, picking best lags and hyperparameters to minimize Mean Absolute Error
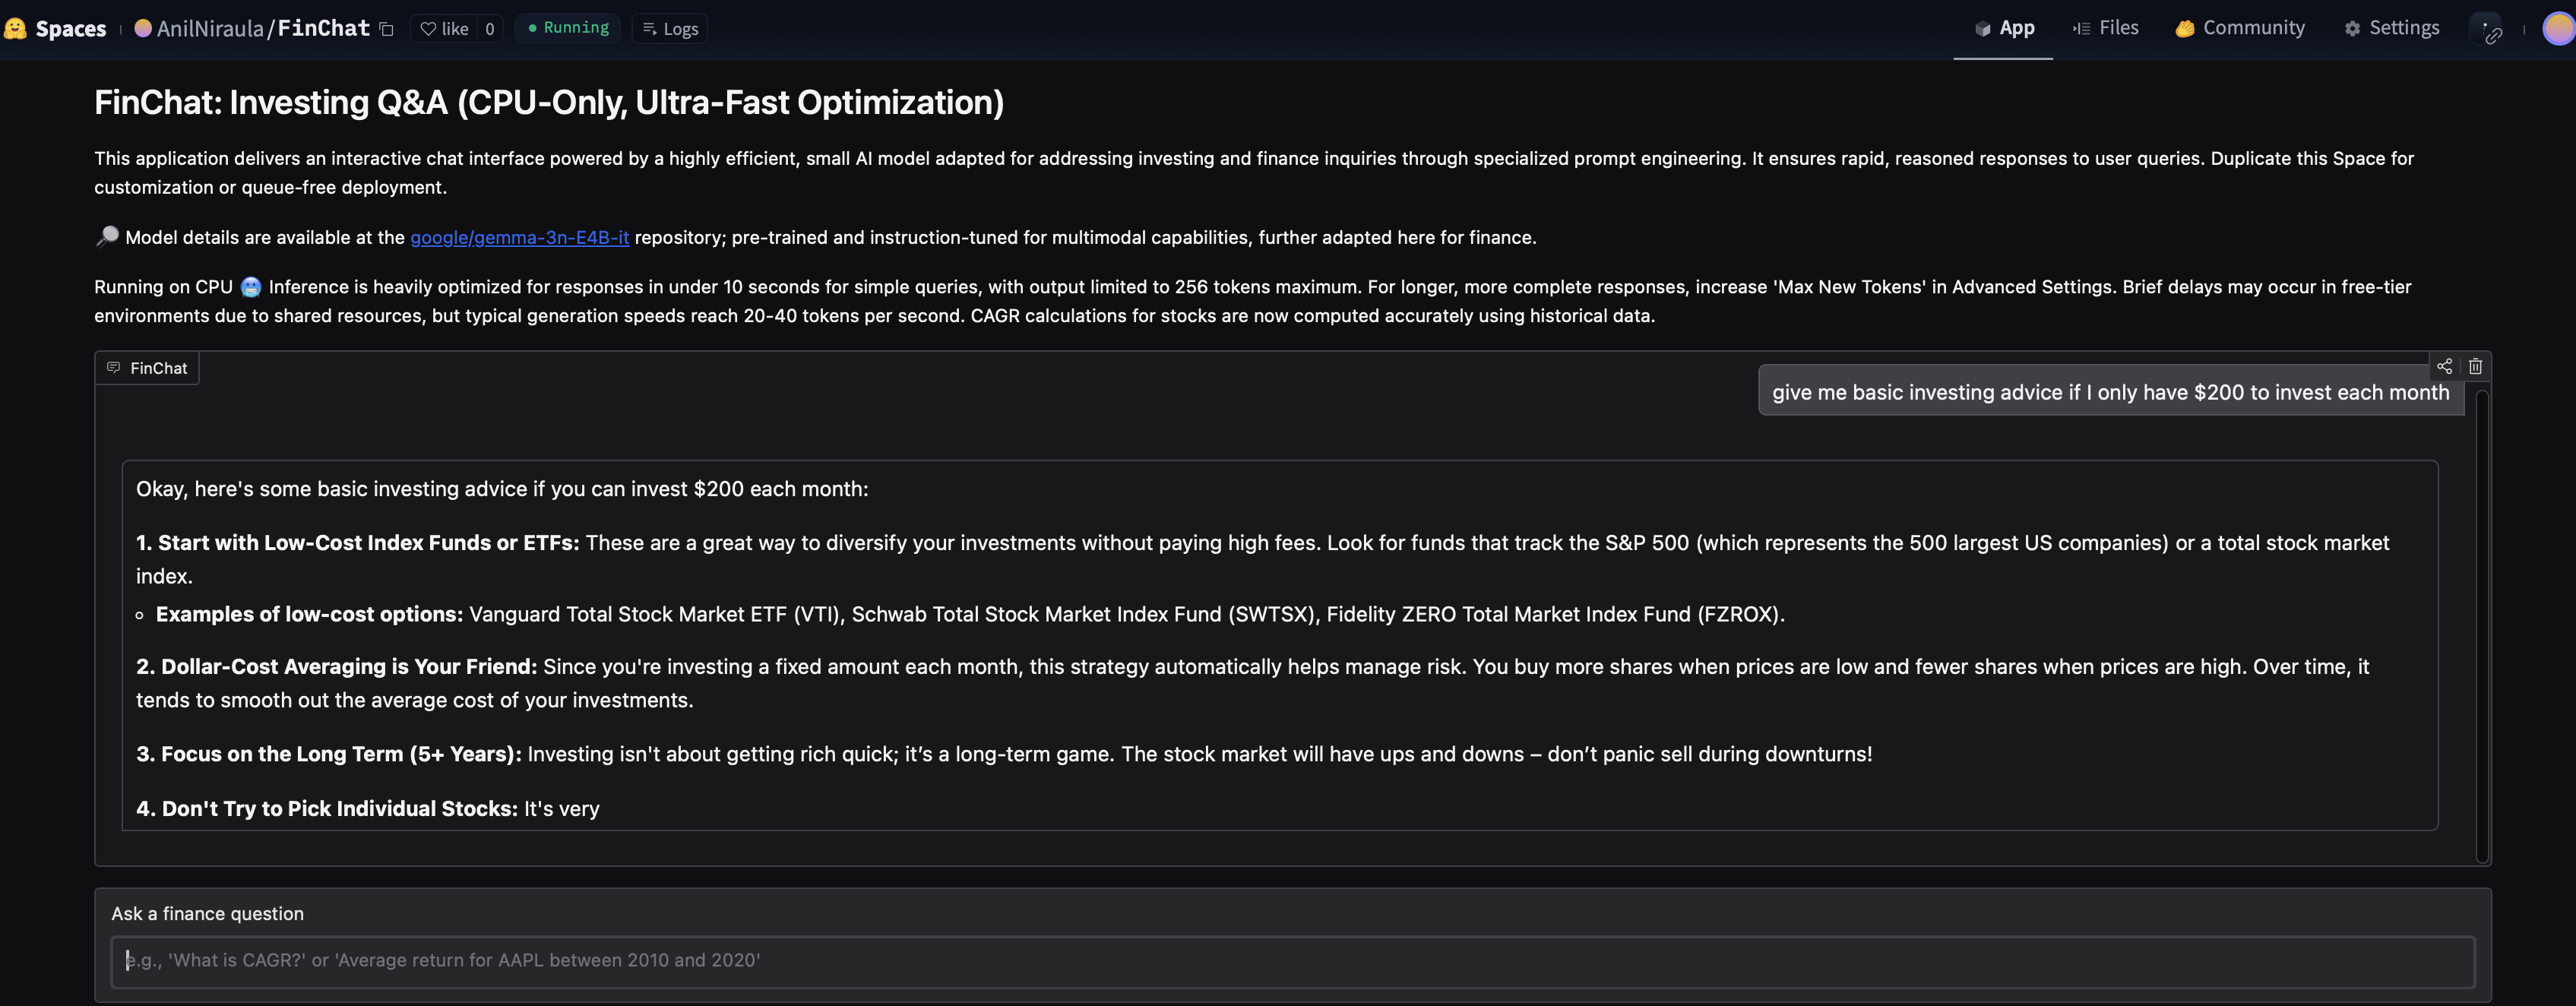
Custom ChatBot with fine-tuned LLM (via Python + Hugging Face)
–LLM based on Google’s Gemma 3n model with more than 2B parameters, fine-tuned using PEFT method with stock price data and financial Q&A data, and hosted online using Hugging Face Spaces, Hugging Face (transformers) & Python (PyTorch, Sklearn etc).
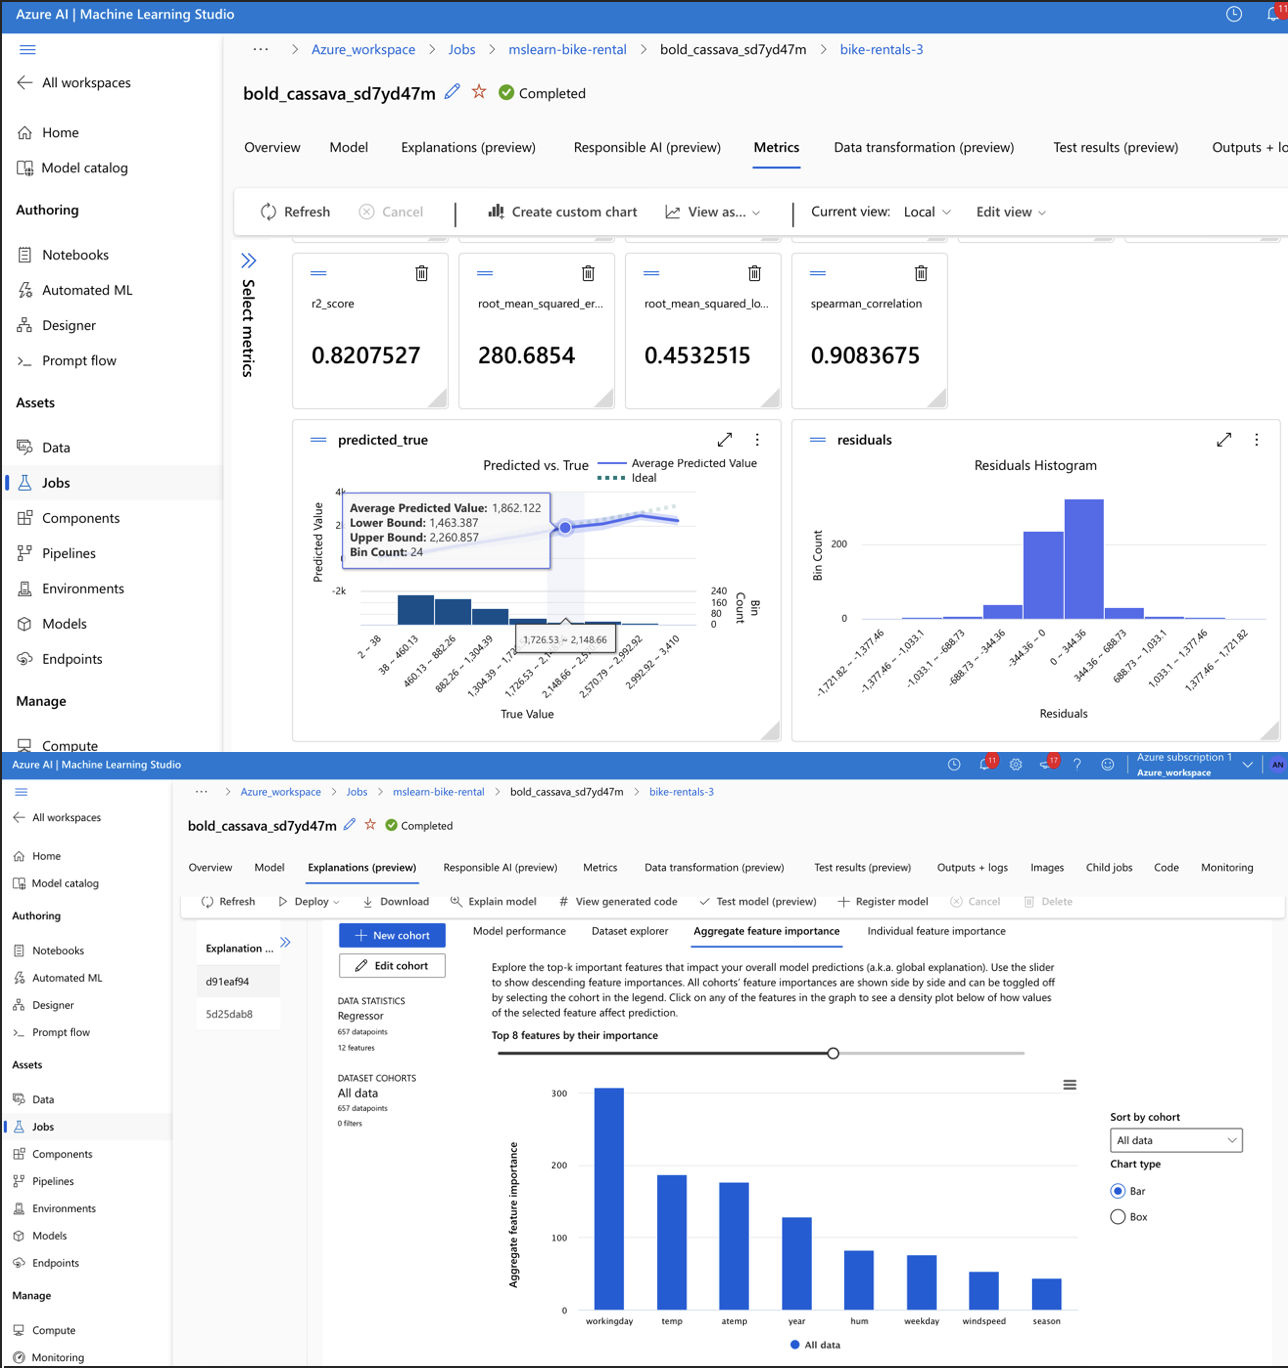
[XGBoostRegressor (Azure AI Machine Learning Studio)]
–Predicting number of bike rentals based on work day, temperature, year etc.
Model error metrics: 0.08 Normalized RMSE and 0.82 R Score.
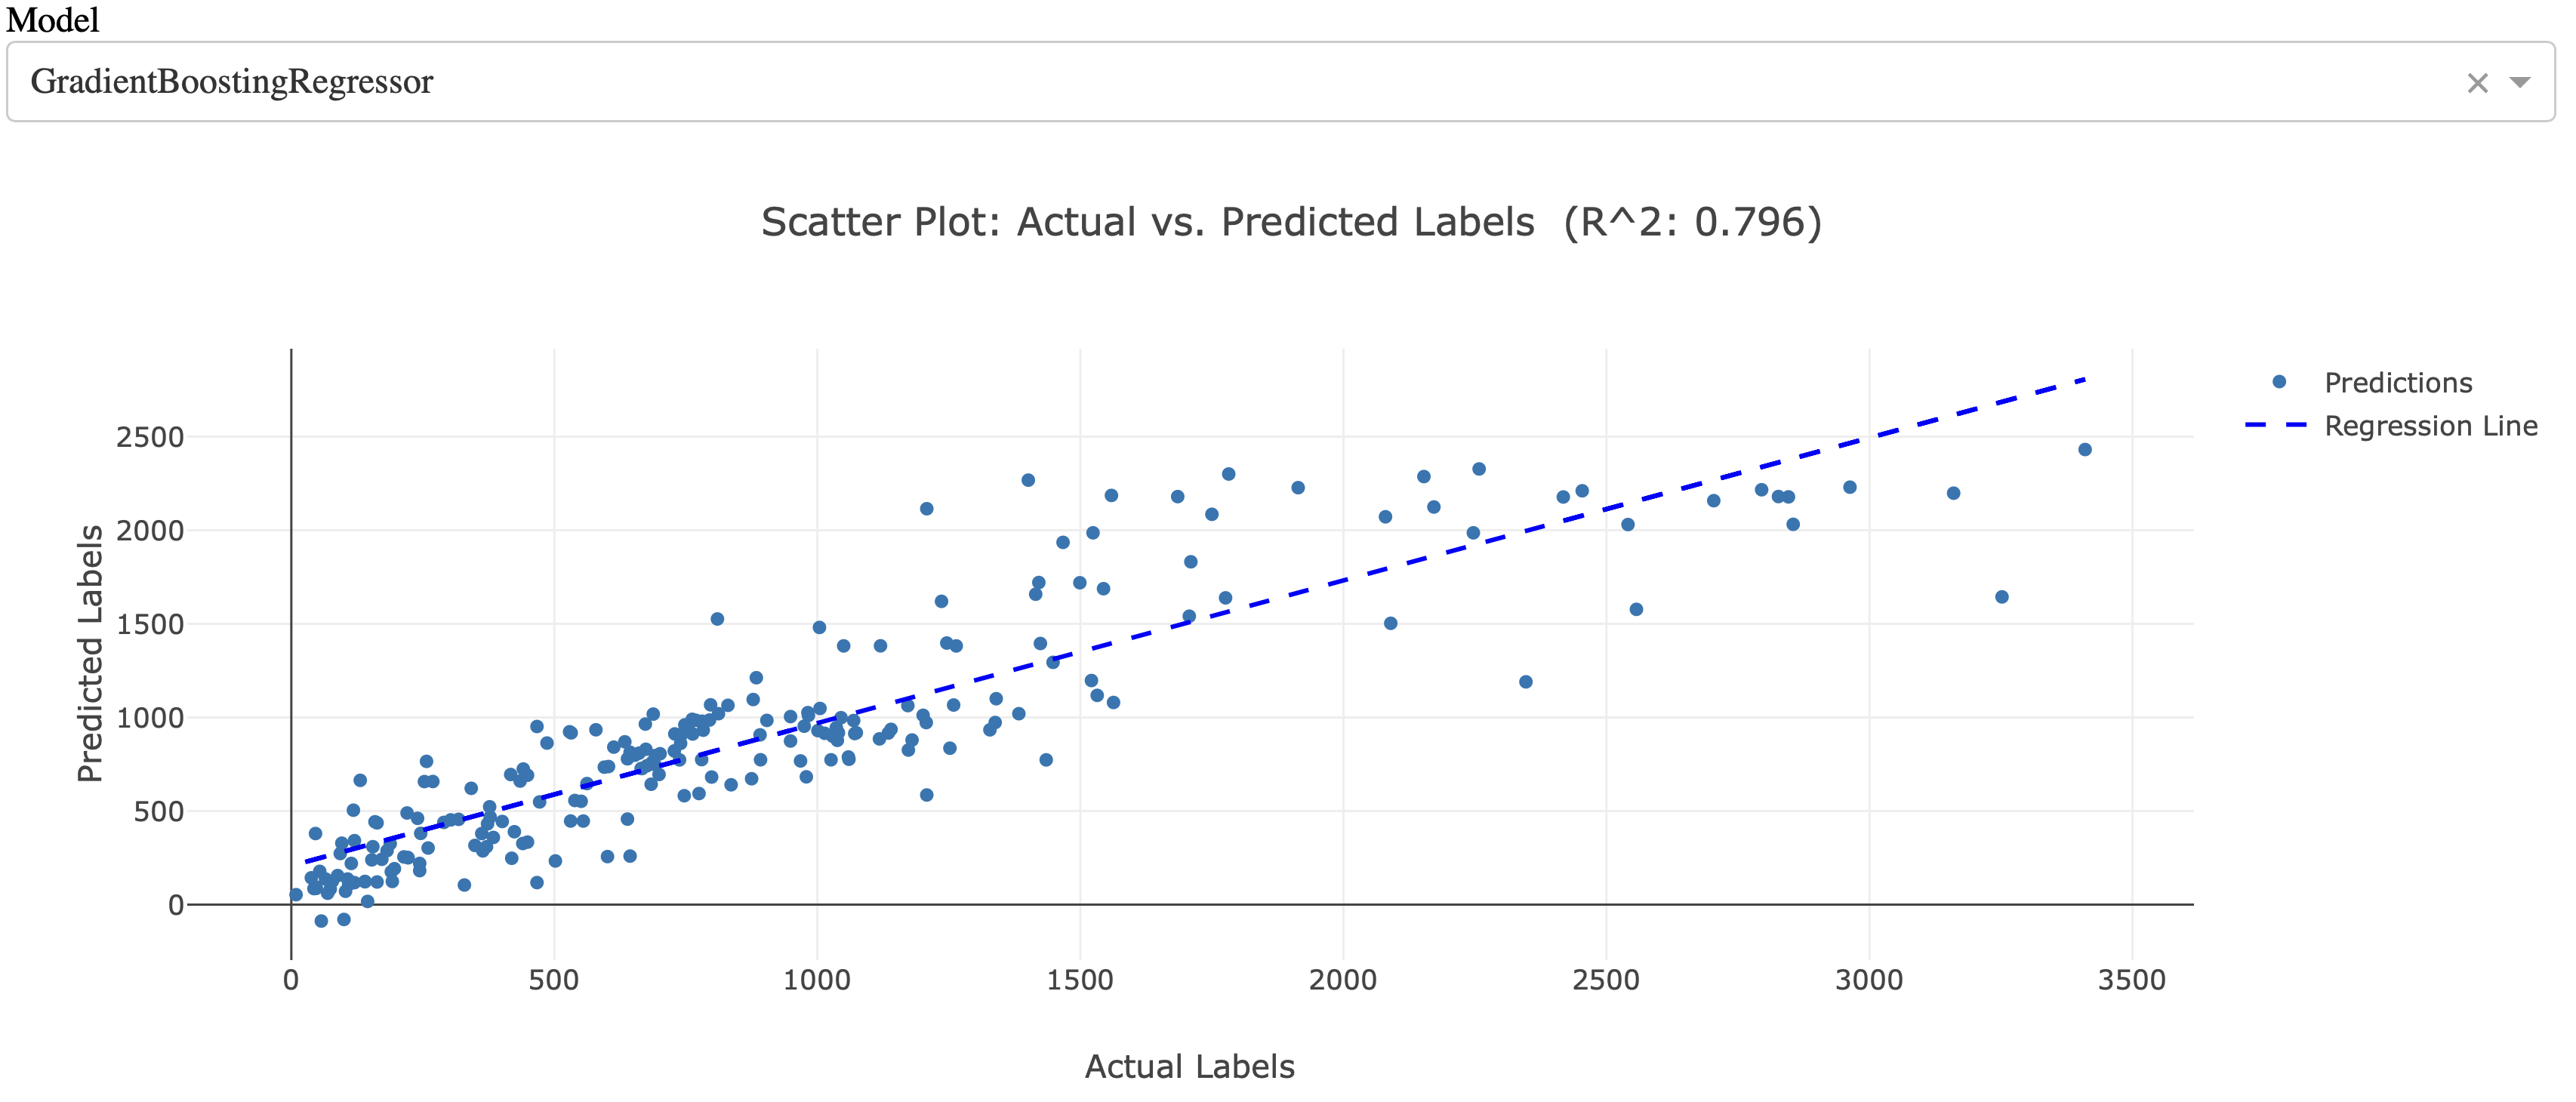
Multiple regression models - actuals vs. predicted (Python sklearn + Dash)
–Predicting number of bike rides per season, temperature, day type, etc.
GradientBoostingRegressor is the most promissing with 0.8 R^2
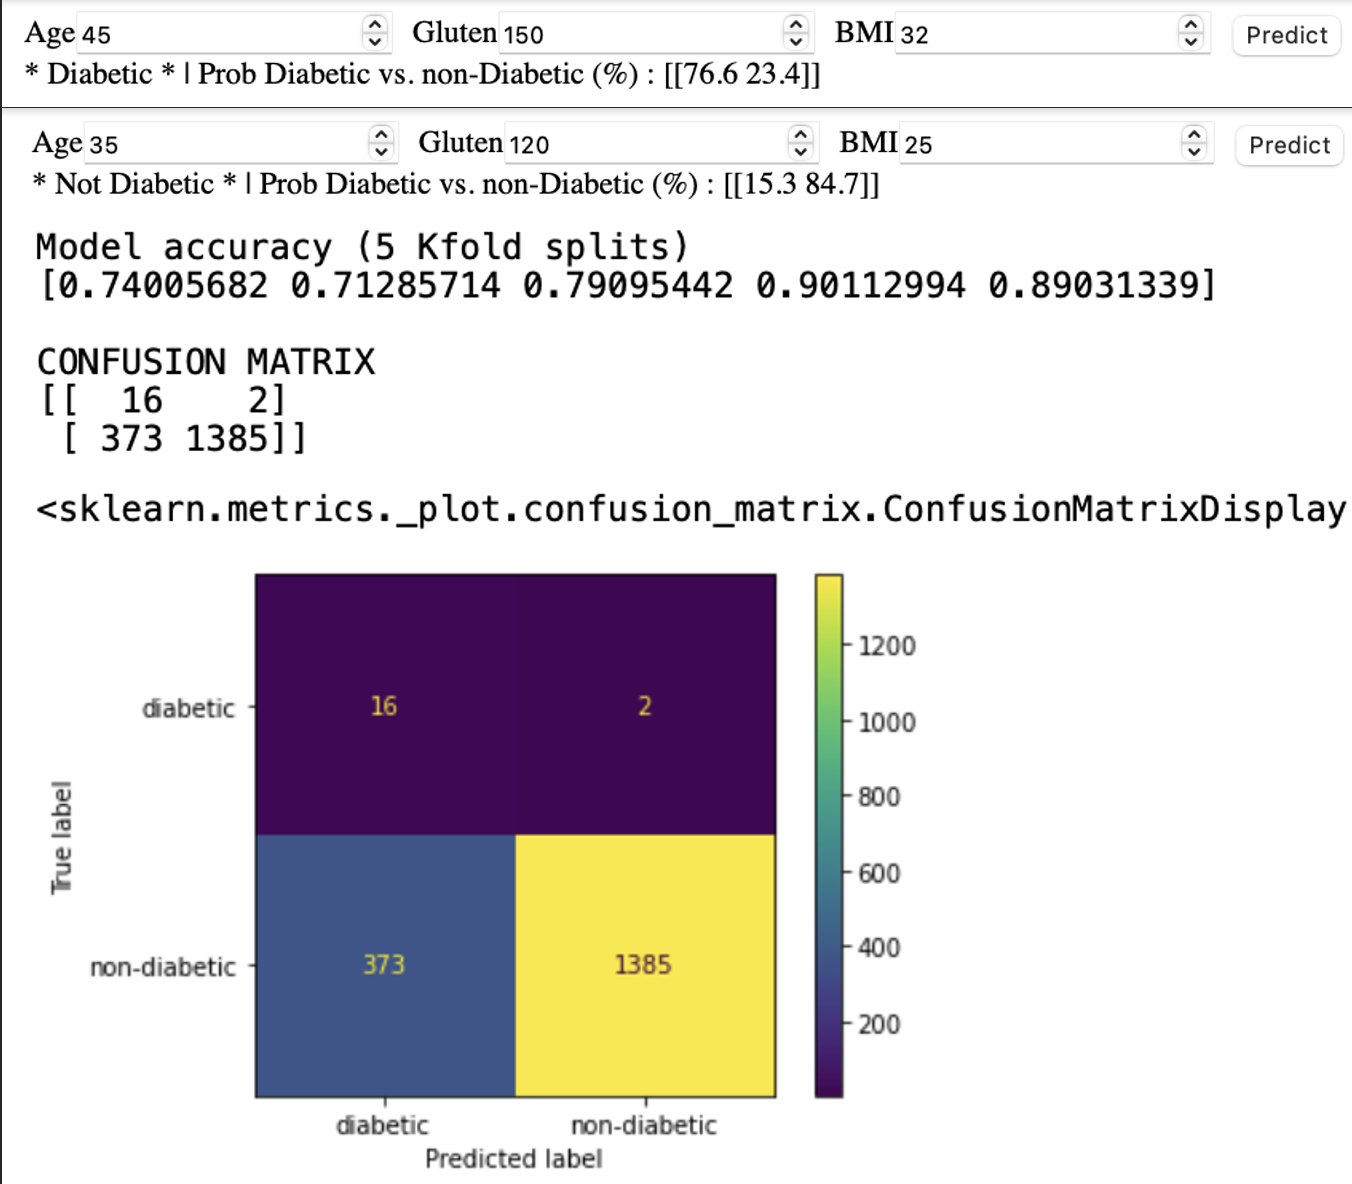
Logistic regression ML (Python sklearn)
–Predicting if a person is Diabetic #1 vs. not #2 based on Age, Glucose level and BMI index
Becasue of small sample of diabetics, I’m using *class_weight = ‘balanced’
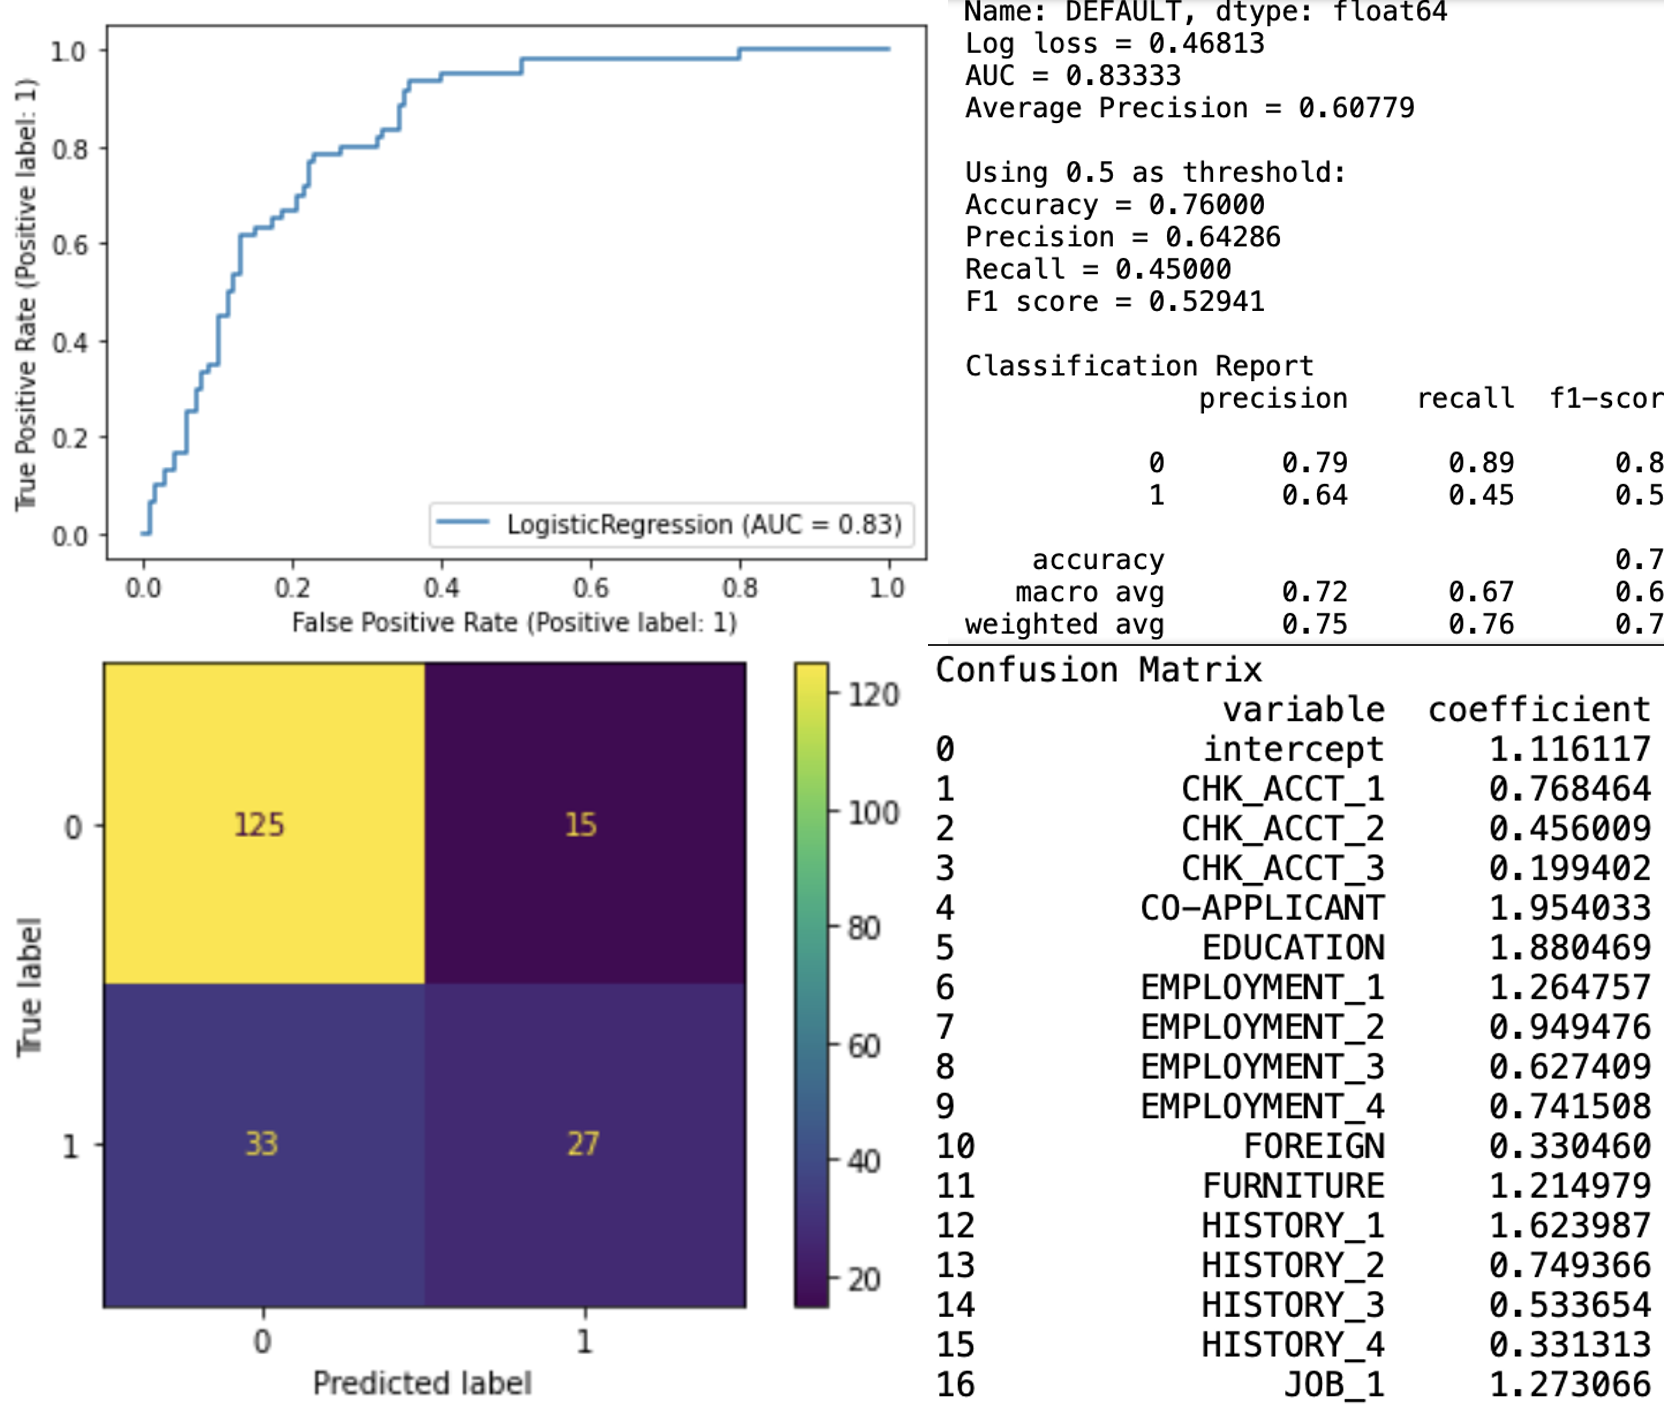
Credit Default Logistic Regression (w/ Python (pandas, sklearn) + Jupyter NoteBook)
– Jupyter Notebook with Python code analyzing credit default data, how load duration, installment rates, living arrangements & other parameters impact probability of a default.
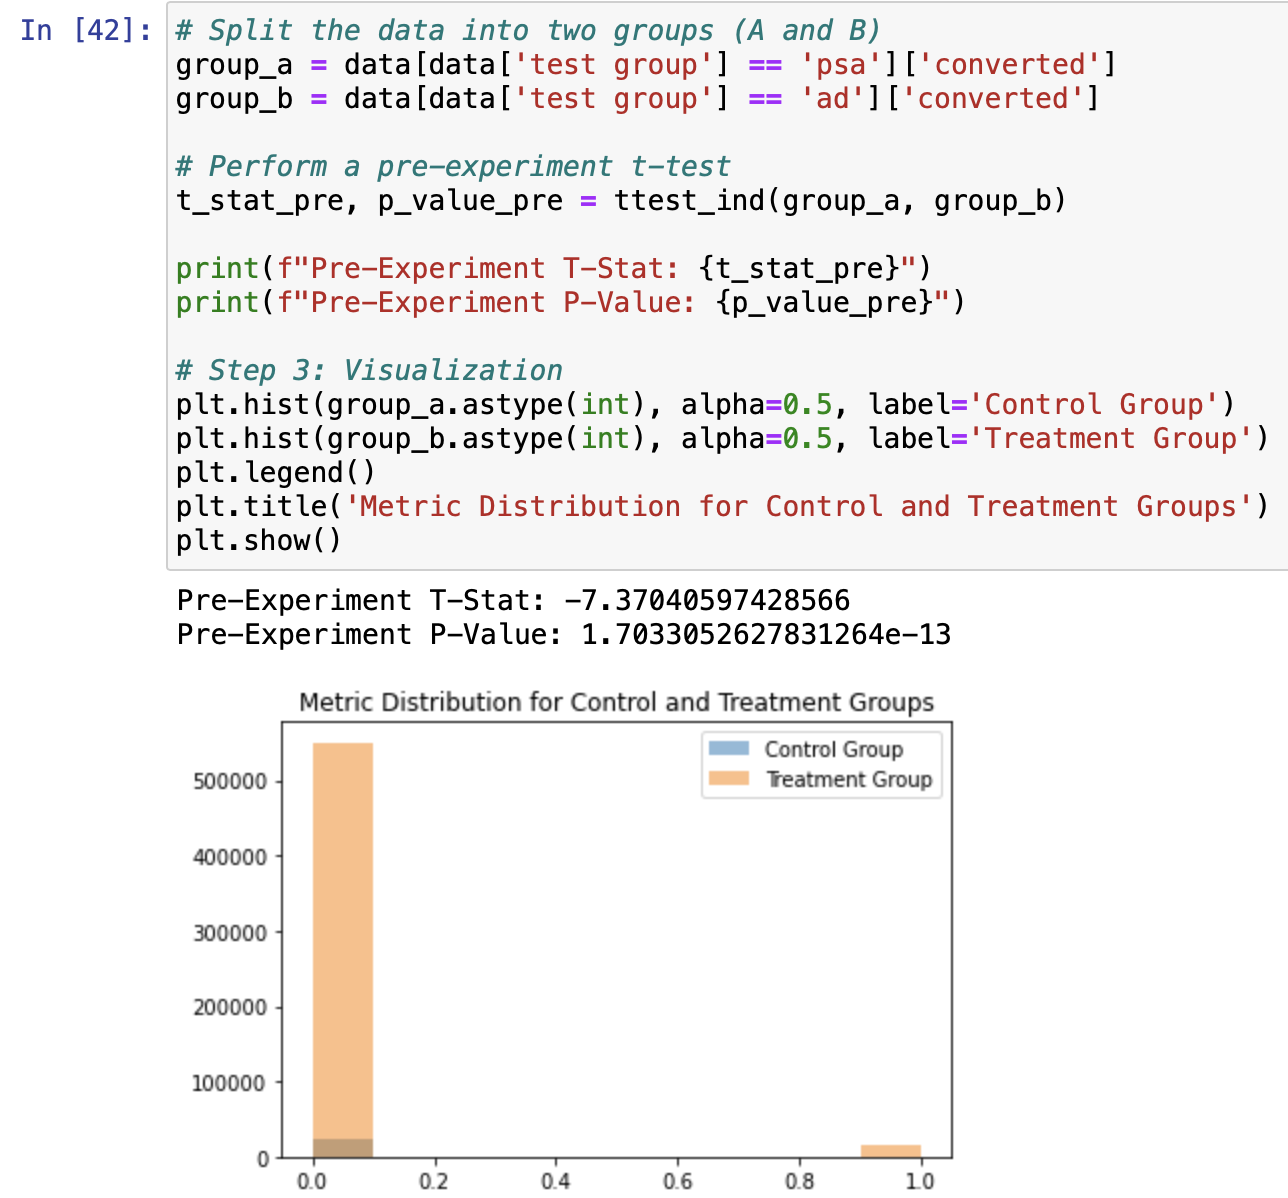
[A/B Testing] (w/ Python (scipy.stats, pandas) in Jupyter NoteBook)
– created Python code analyzing advertising experiment on Treatment group, using Control group as a baseline showing how T-tests can be used to see statistical difference in outcomes (conversion rate) before and after the advertising.
–
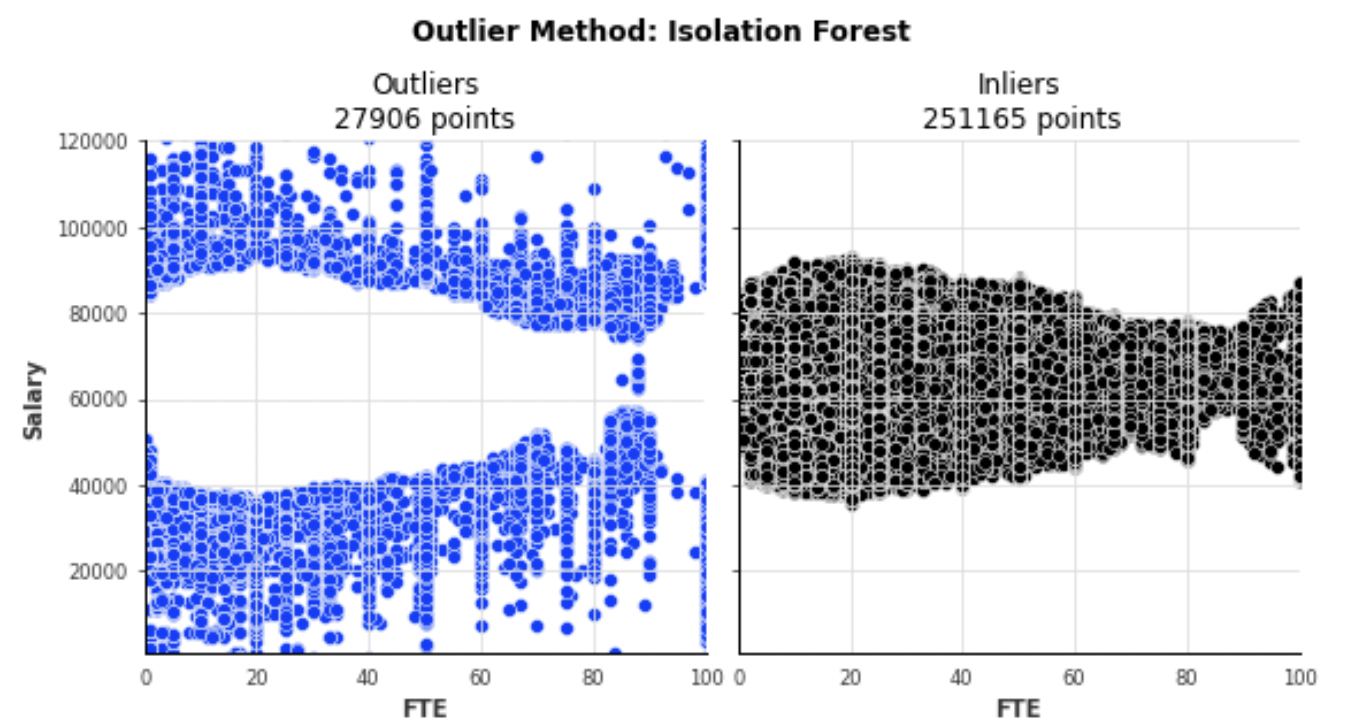
Isolation Forest (w/ Python sklearn.ensemble + seaborn)
– Detecting Inliners and Outliers based on salary and FTE, assuming 10% of population are outliers (Unsupervised learning)
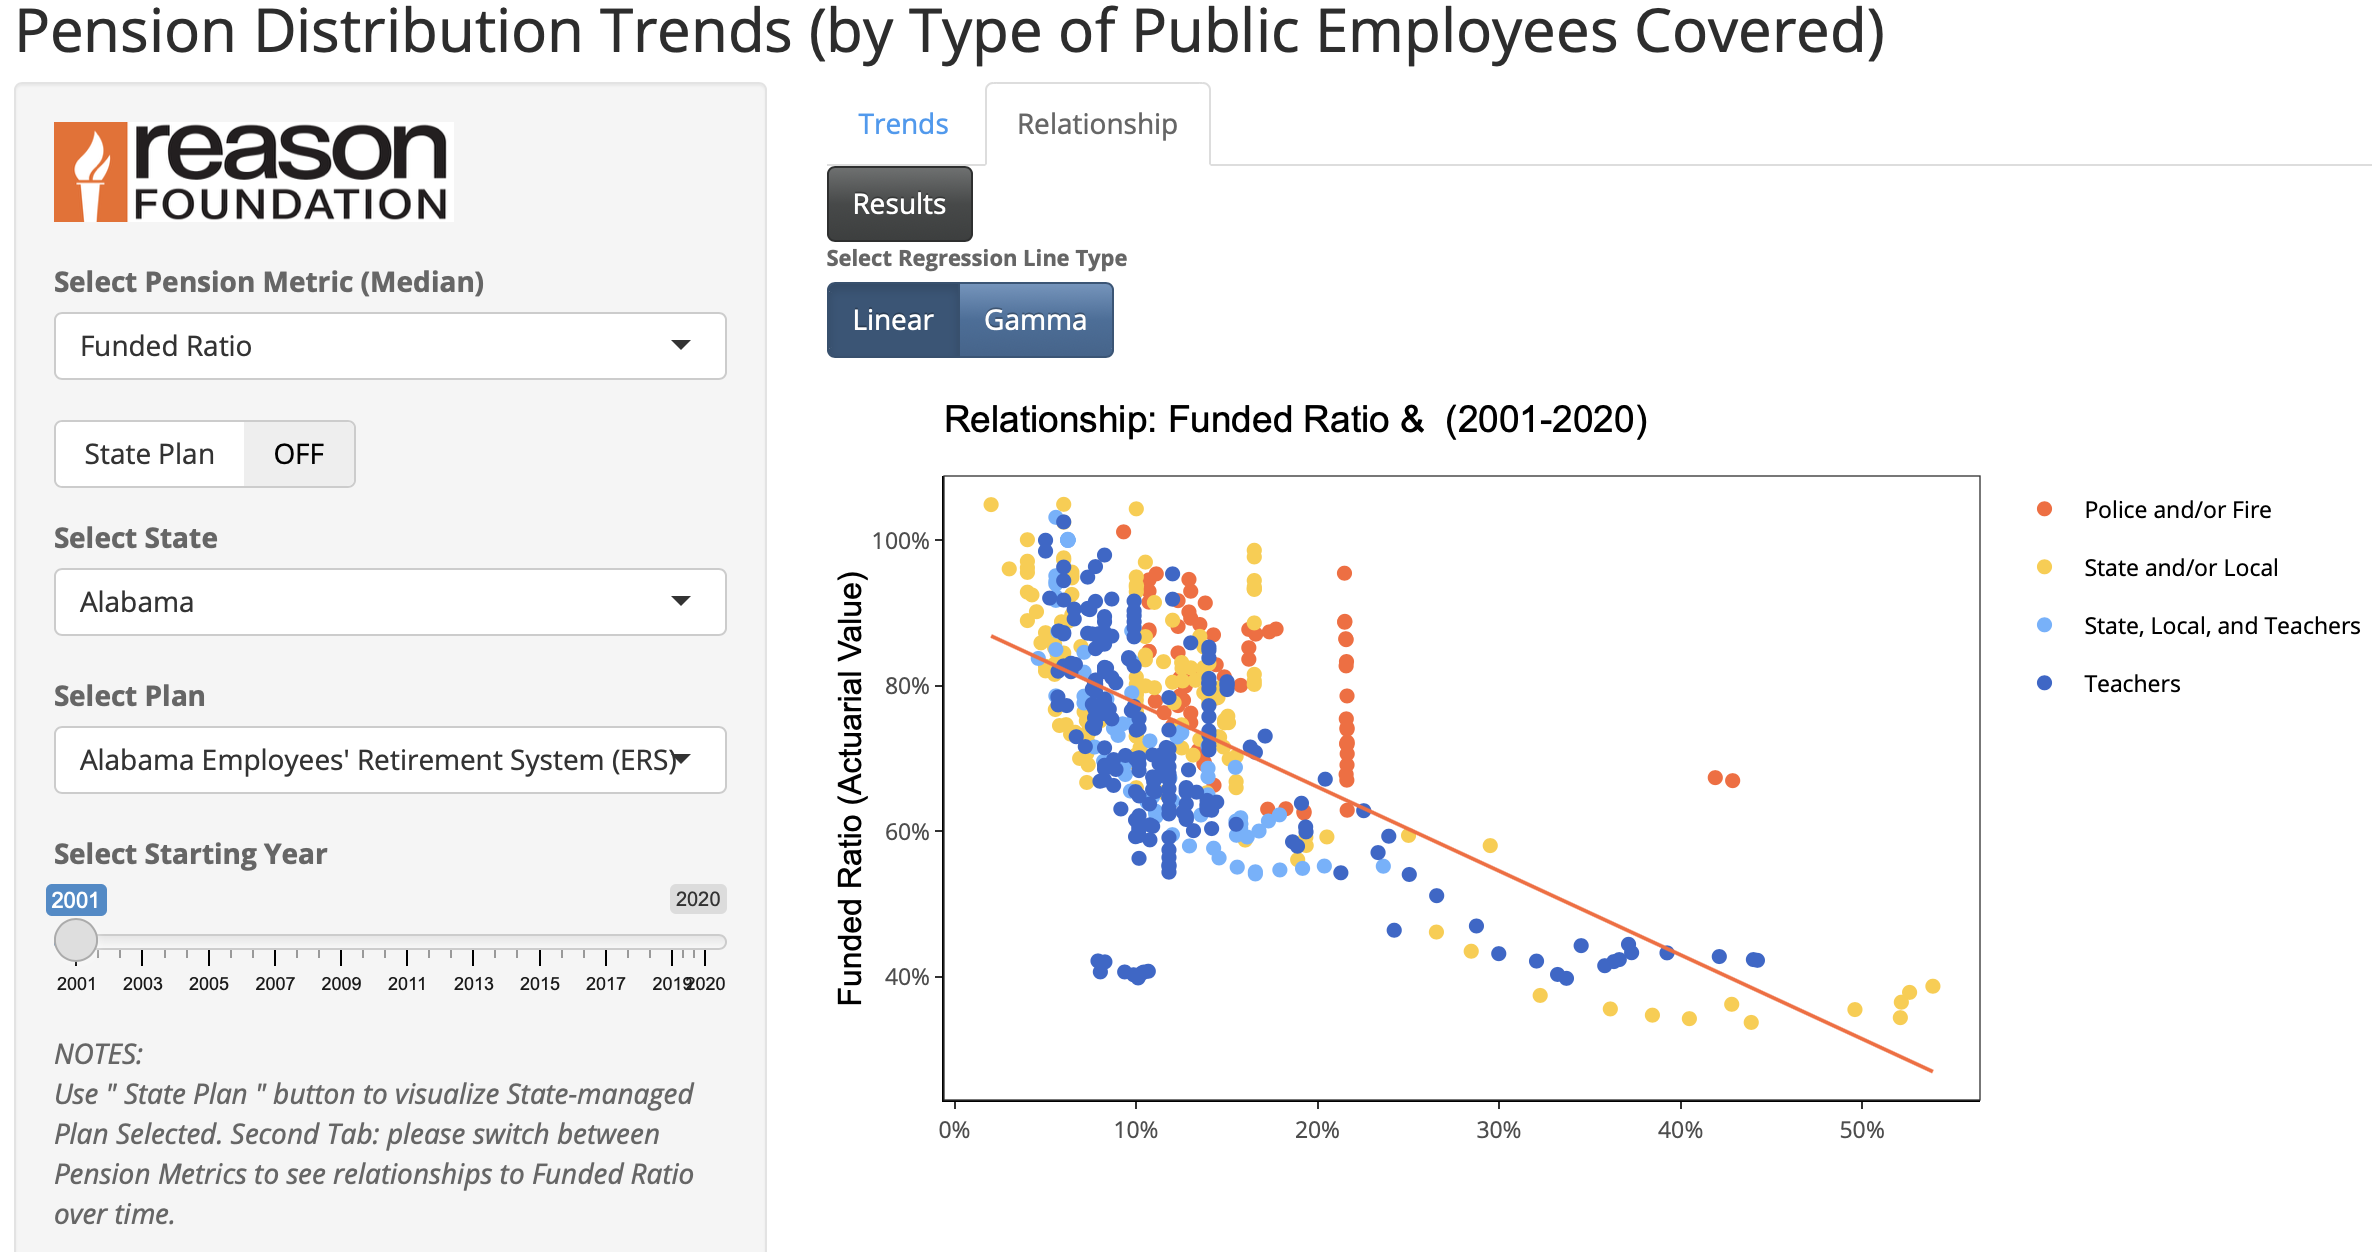
Pension Trends Linear Regression (w/ R Shiny)
– Interactive app that allows to build boxplots and linear regression by picking 2 variables and Type of public employee.
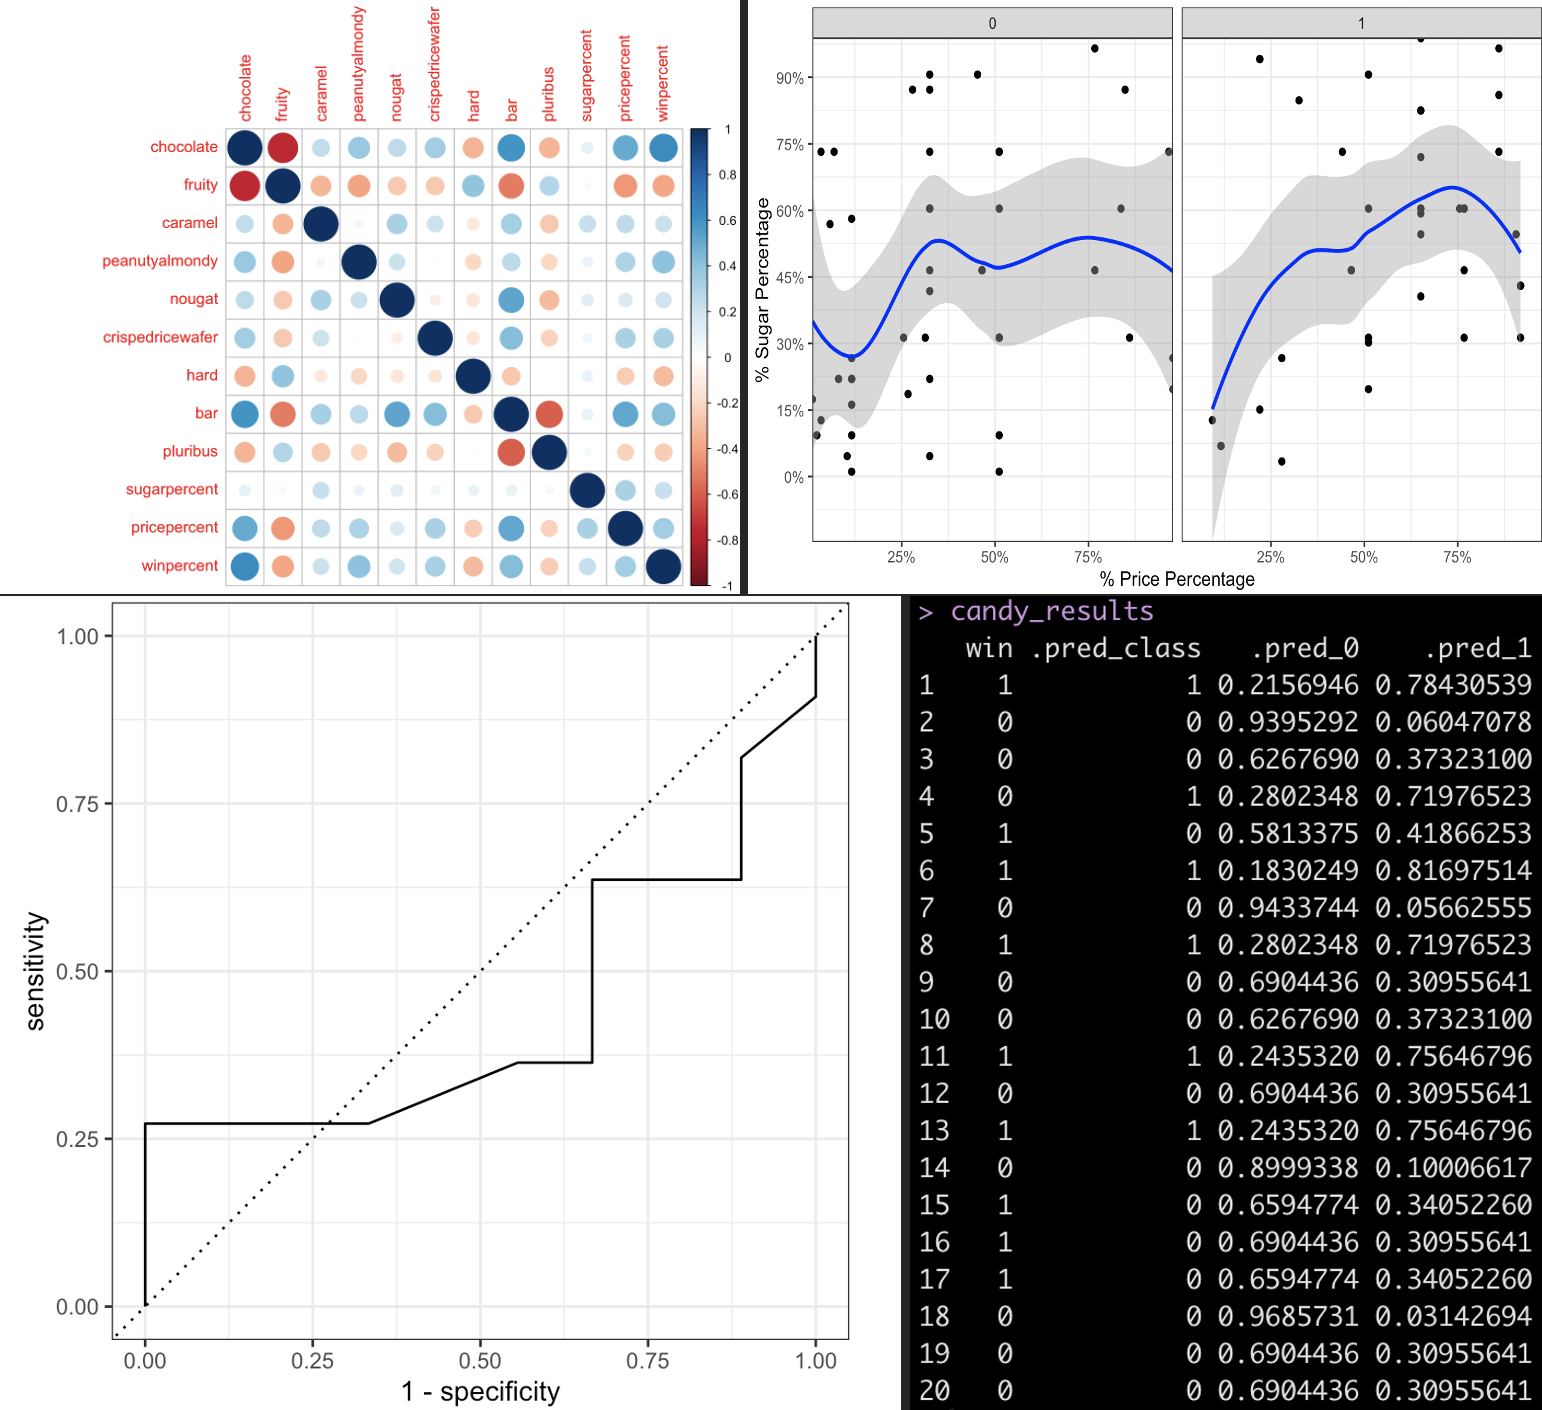
Candy Data Logistic Regression (w/ R + Jupyter NoteBook)
– Jupyter Notebook with R code analyzing candy data, price-to-sugar relationship & why some win more often when matched than others.
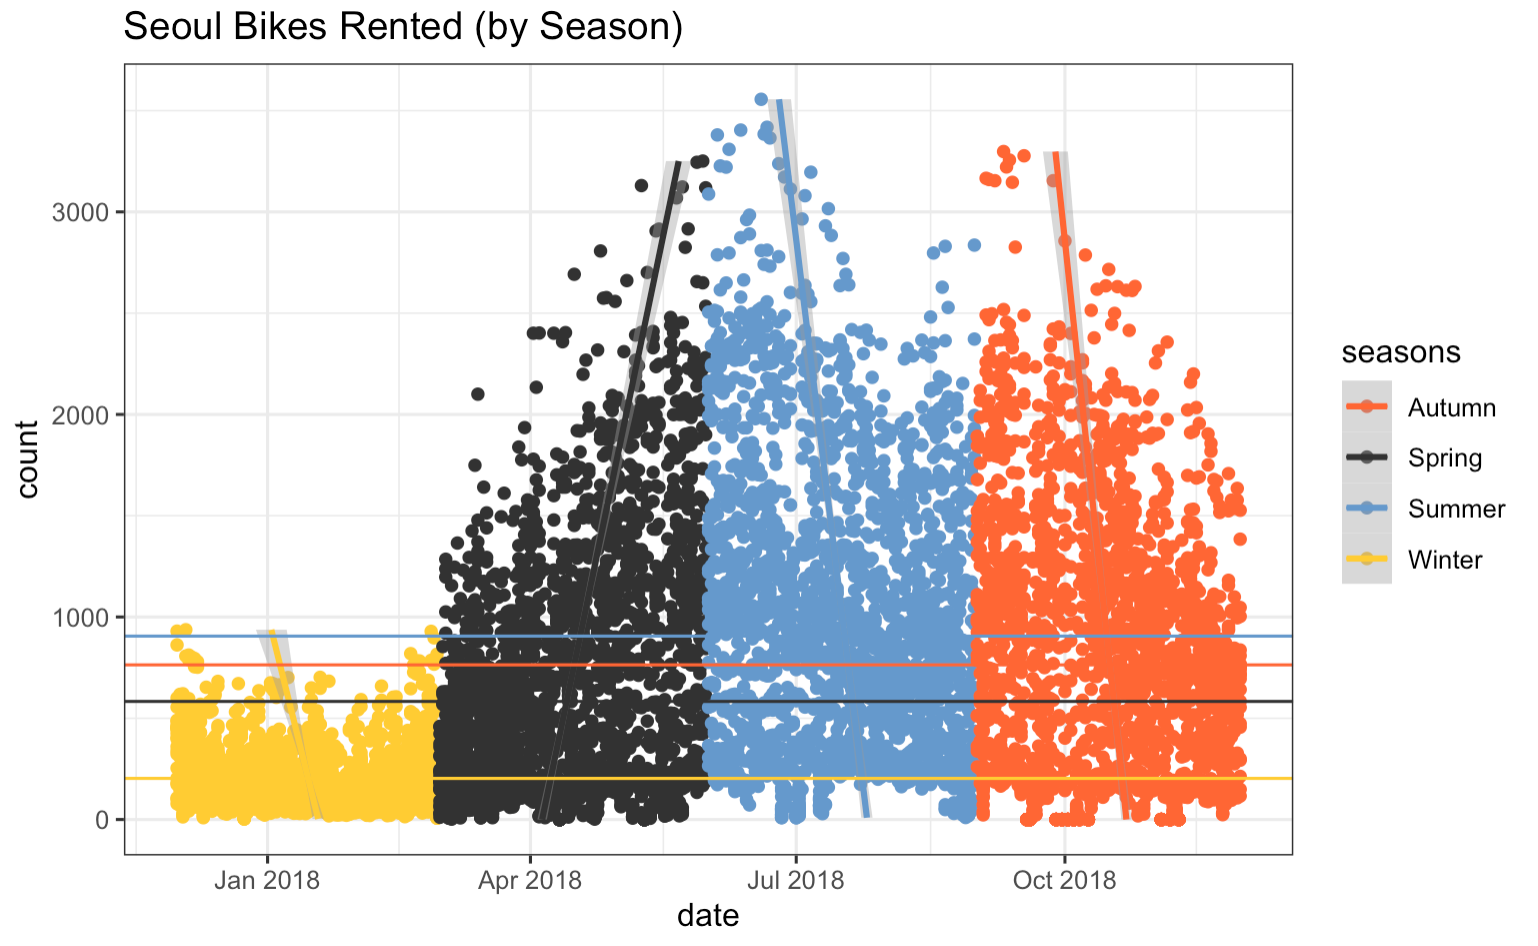
Seoul Bike Share Analysis (w/ R + R Markdown)
– Analyzing 2018 data on bikes rented in Seoul and parameters (like season, temperature, and hour) that impact the number of bikes rented.
Managing & Analyzing Data
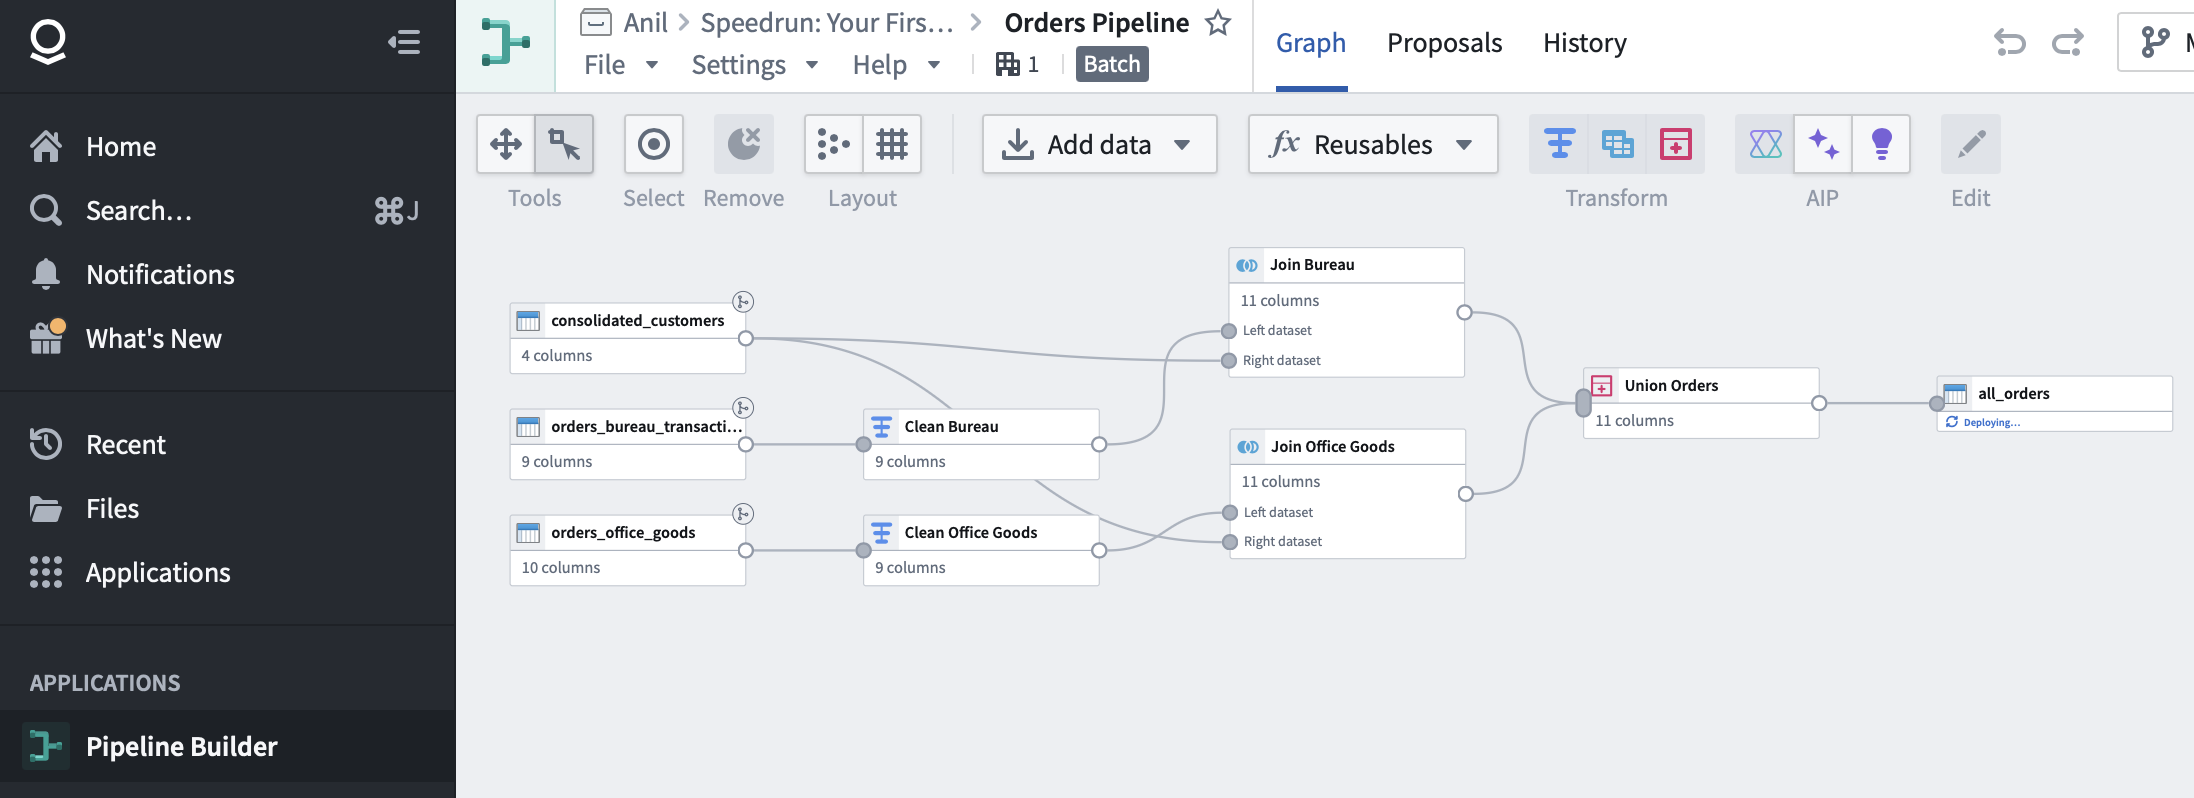
[Data workflow (Palantir Foundry)]
– Interactive data pipeline using Palantir Foundry that cleans, sorts, and joints two tables.
Pension Database (App w/ PostgreSQL + R Shiny)
– Interactive app showing 2001-2021 data for 110+ U.S. pension plans from internal database & linked public sources. User can filter data by state, by plan, by starting year, select columns, view interactive charts, and download filtered data in csv format.
.png?raw=true)
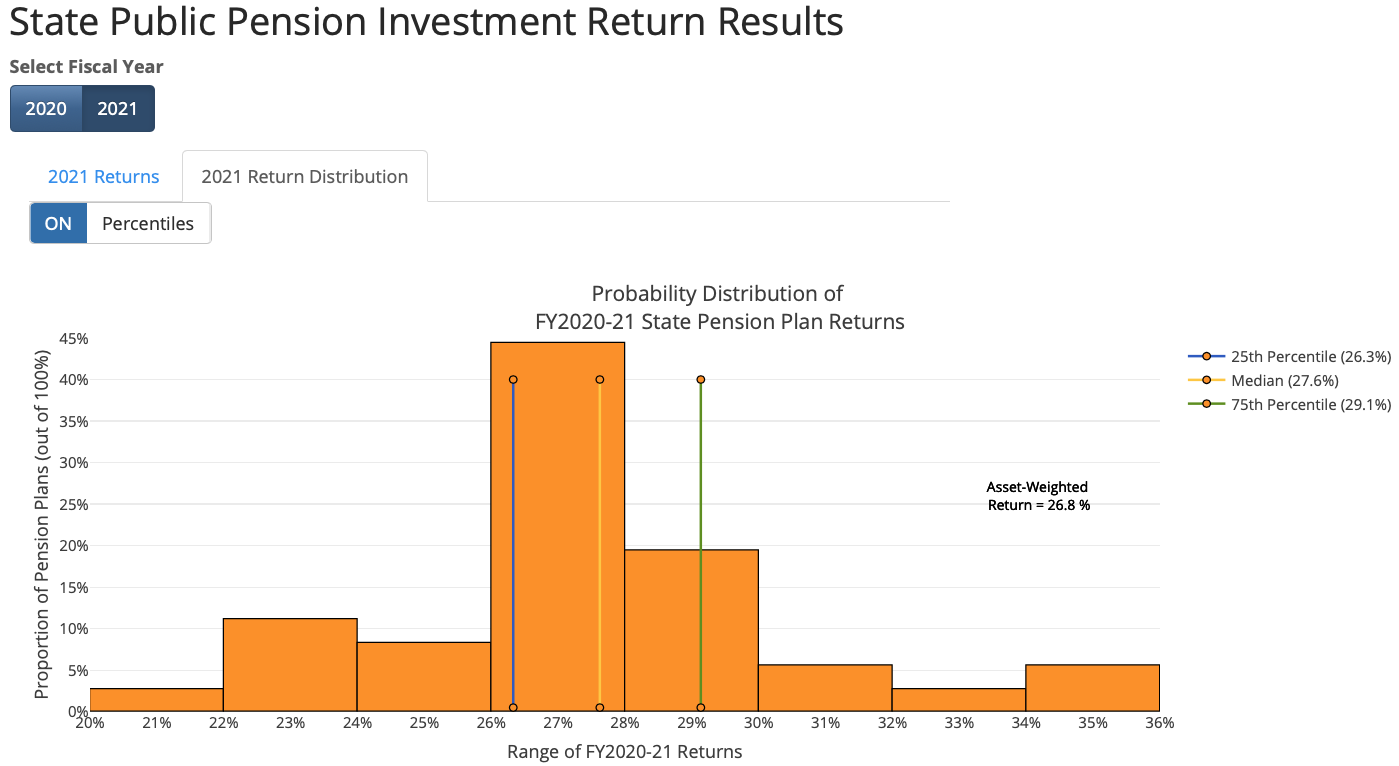
Invesment Returns (App w/ R Reactable + Shiny)
– Interactive table & histogram/line chart showing distribution of 2020-2021 pension plan investment returns, and 2001-2021 pension debt.
User can filter data by state, plan, and add percentiles to distribution histogram
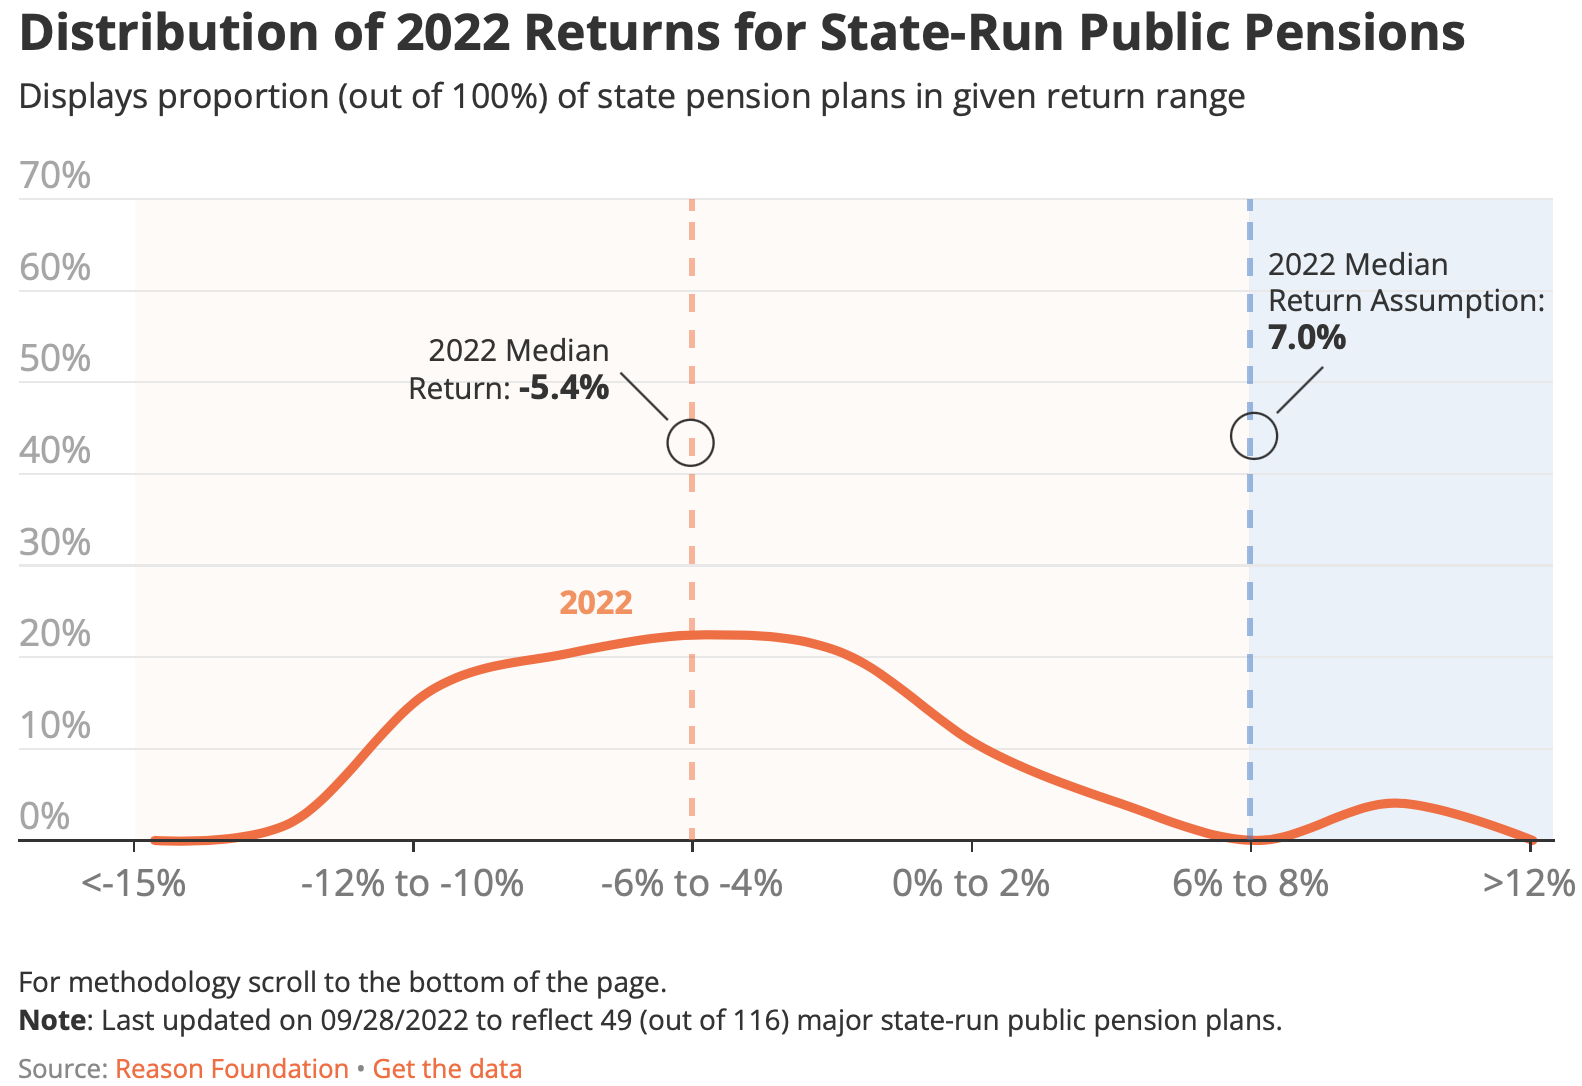
Invesment Returns 2022 (App w/ R + datawrapper)
– Interactive table & line chart showing distribution of 2022 pension plan investment returns built using R for data manipulation & datawrapper for front-end
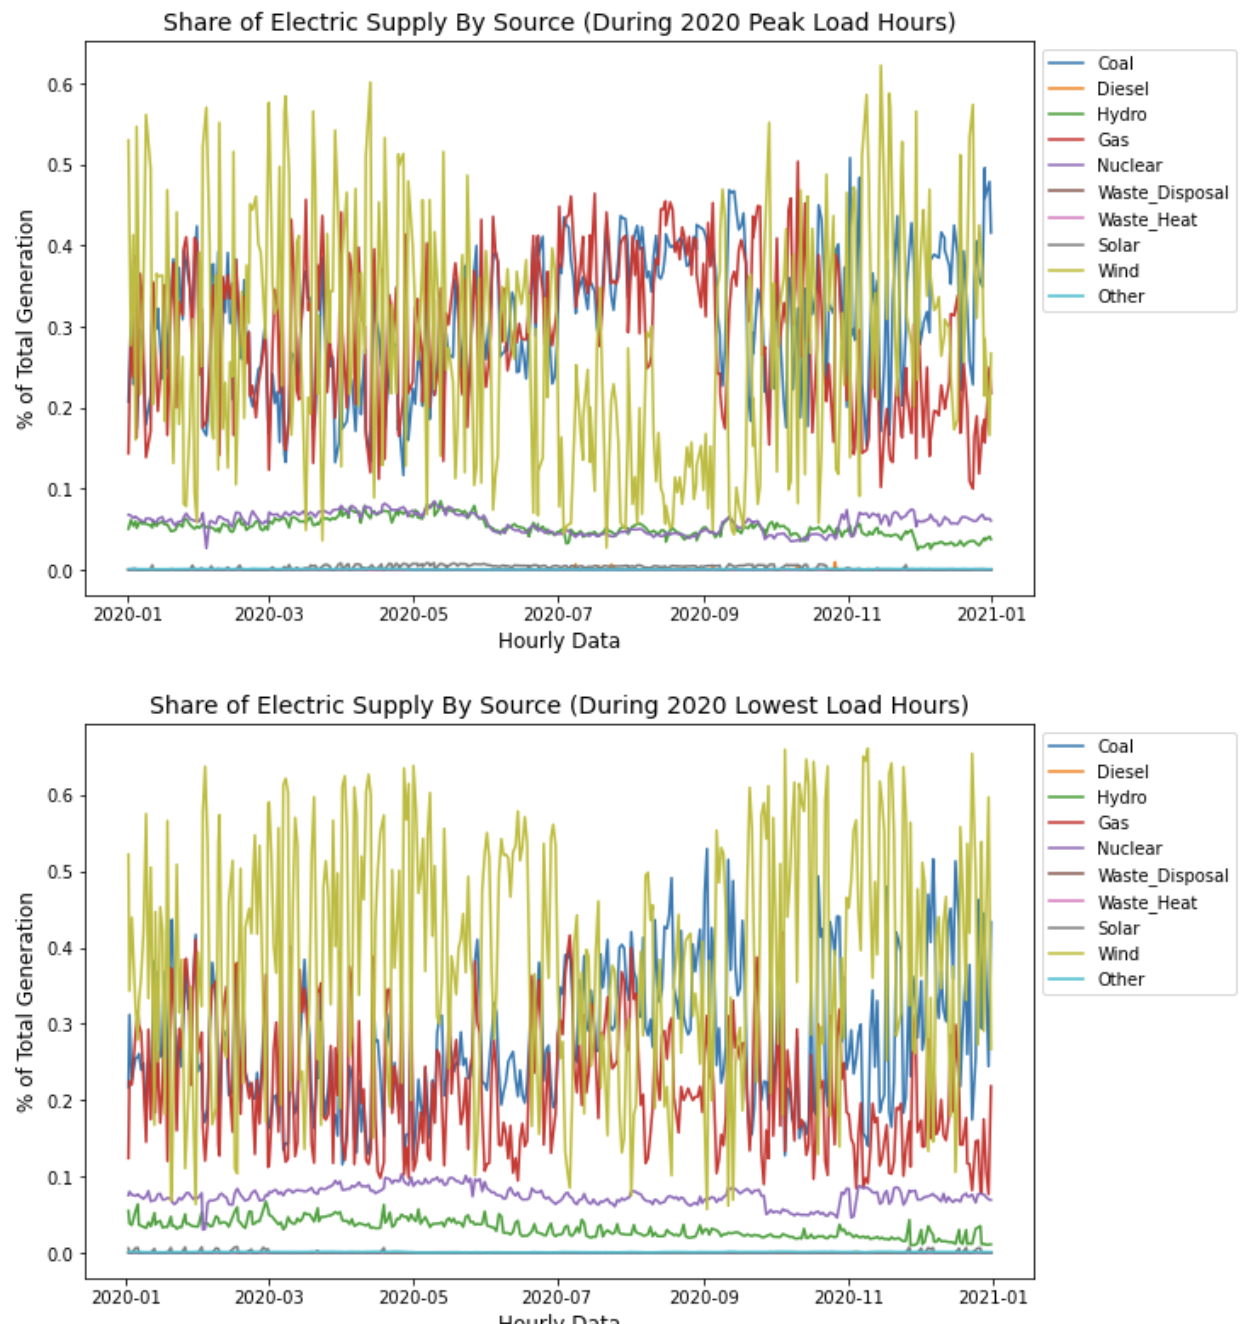
US Electricity Supply/Demand (Viz w/ Python pandas)
– Line Charts showing share of US electricity supply at Peak and Low-load hours during each day in 2020
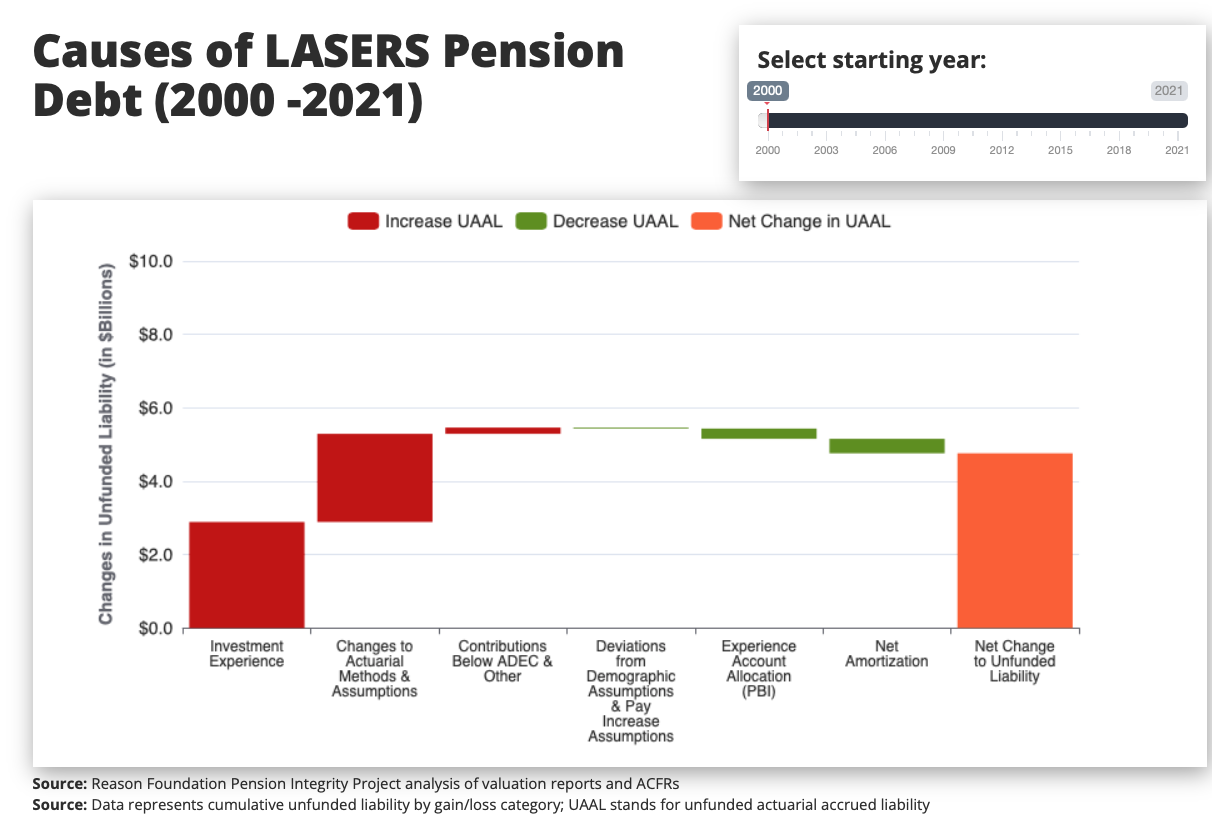
Compound Change in Debt (App w/ Shiny + HTML + Netlify)
– Interactive Waterfall chart showing how pension plan’s debt compounded (by category) over 2000-2021 period. Slider resets starting year.
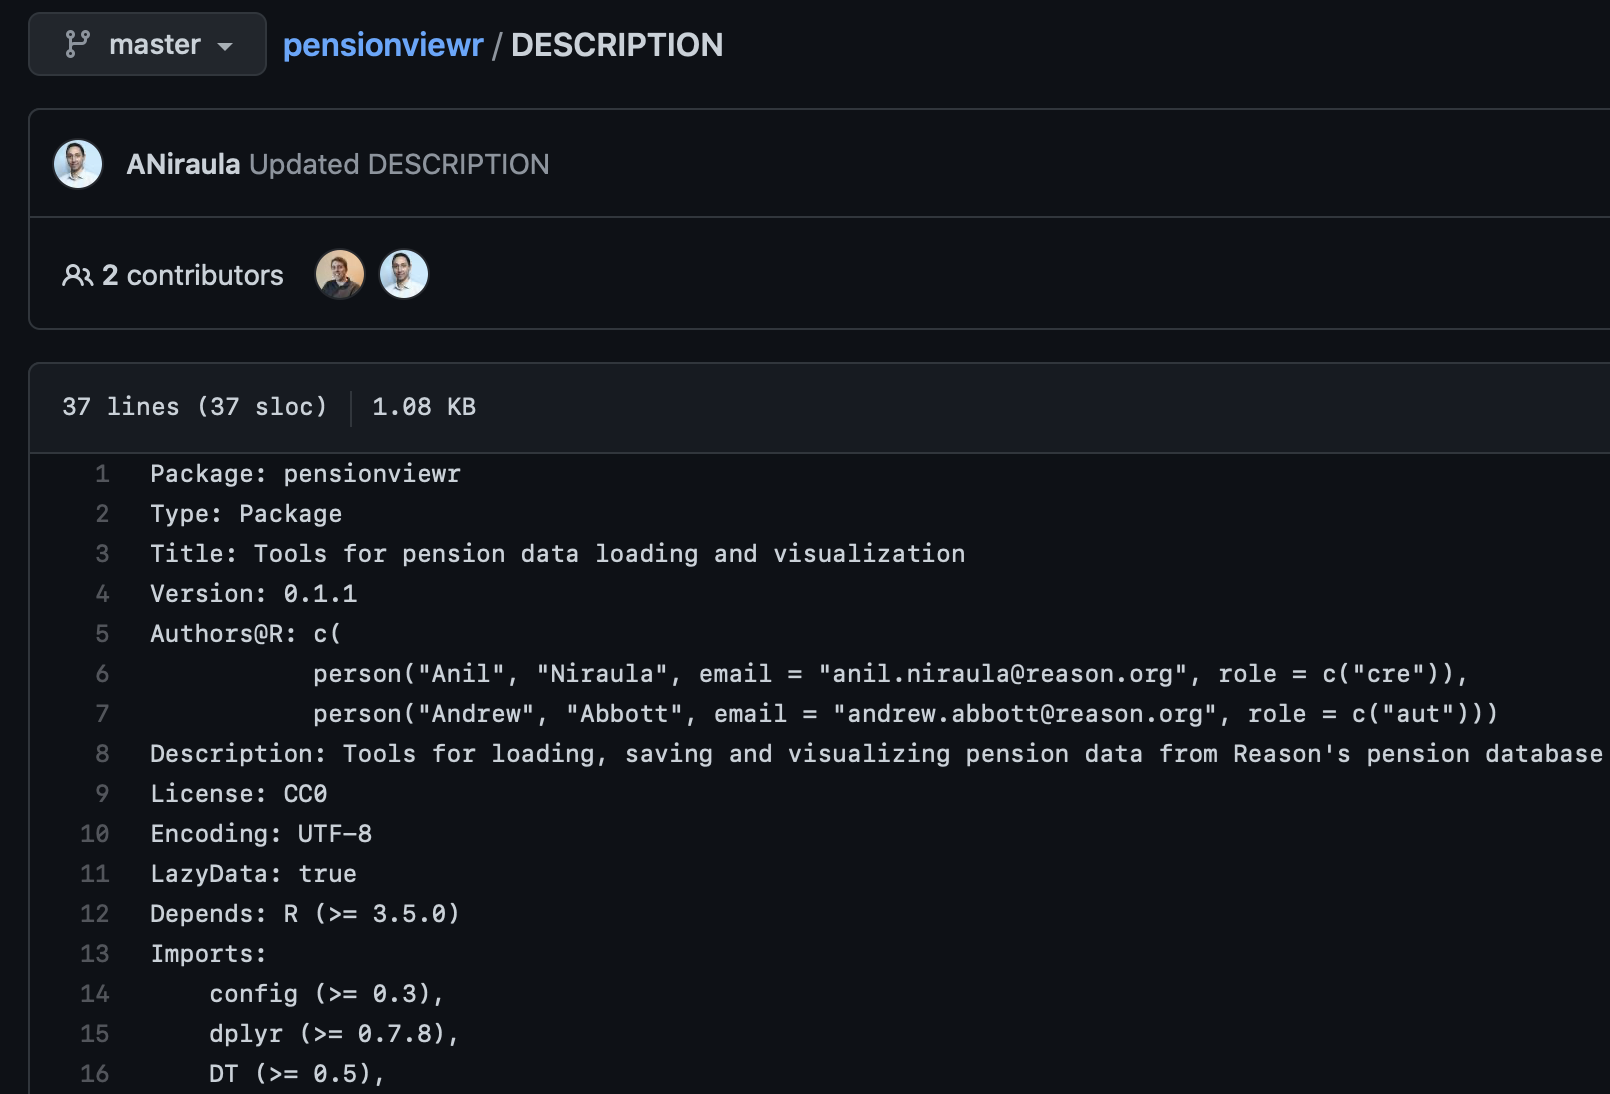
R Package (w/ R + Roxygen2 + GitHub)
– “pensionviewr” R package contains functions to pull, filter, manipulate, and visualize pension data from internal database & public sources.
Automating Reports/Presentations
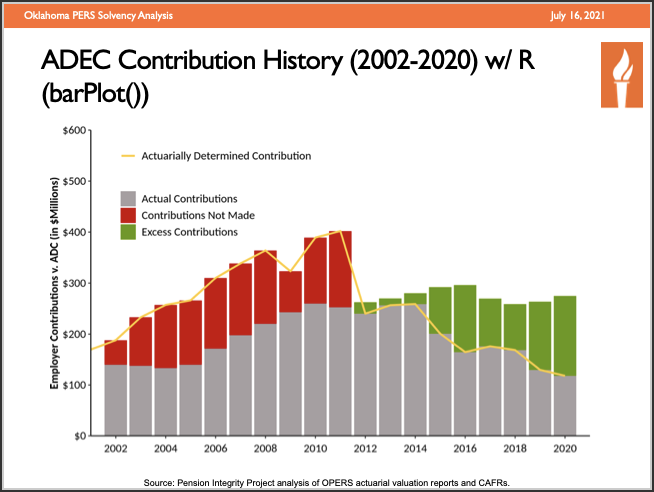
PowerPoint Slides (w/ RMarkdown + “pensionviewr” R pkg)
– RMarkdown files allow to automate pulling, analyzing and visualizing data, then knit charts/text/tables into set of powerpoint slides.
Modeling
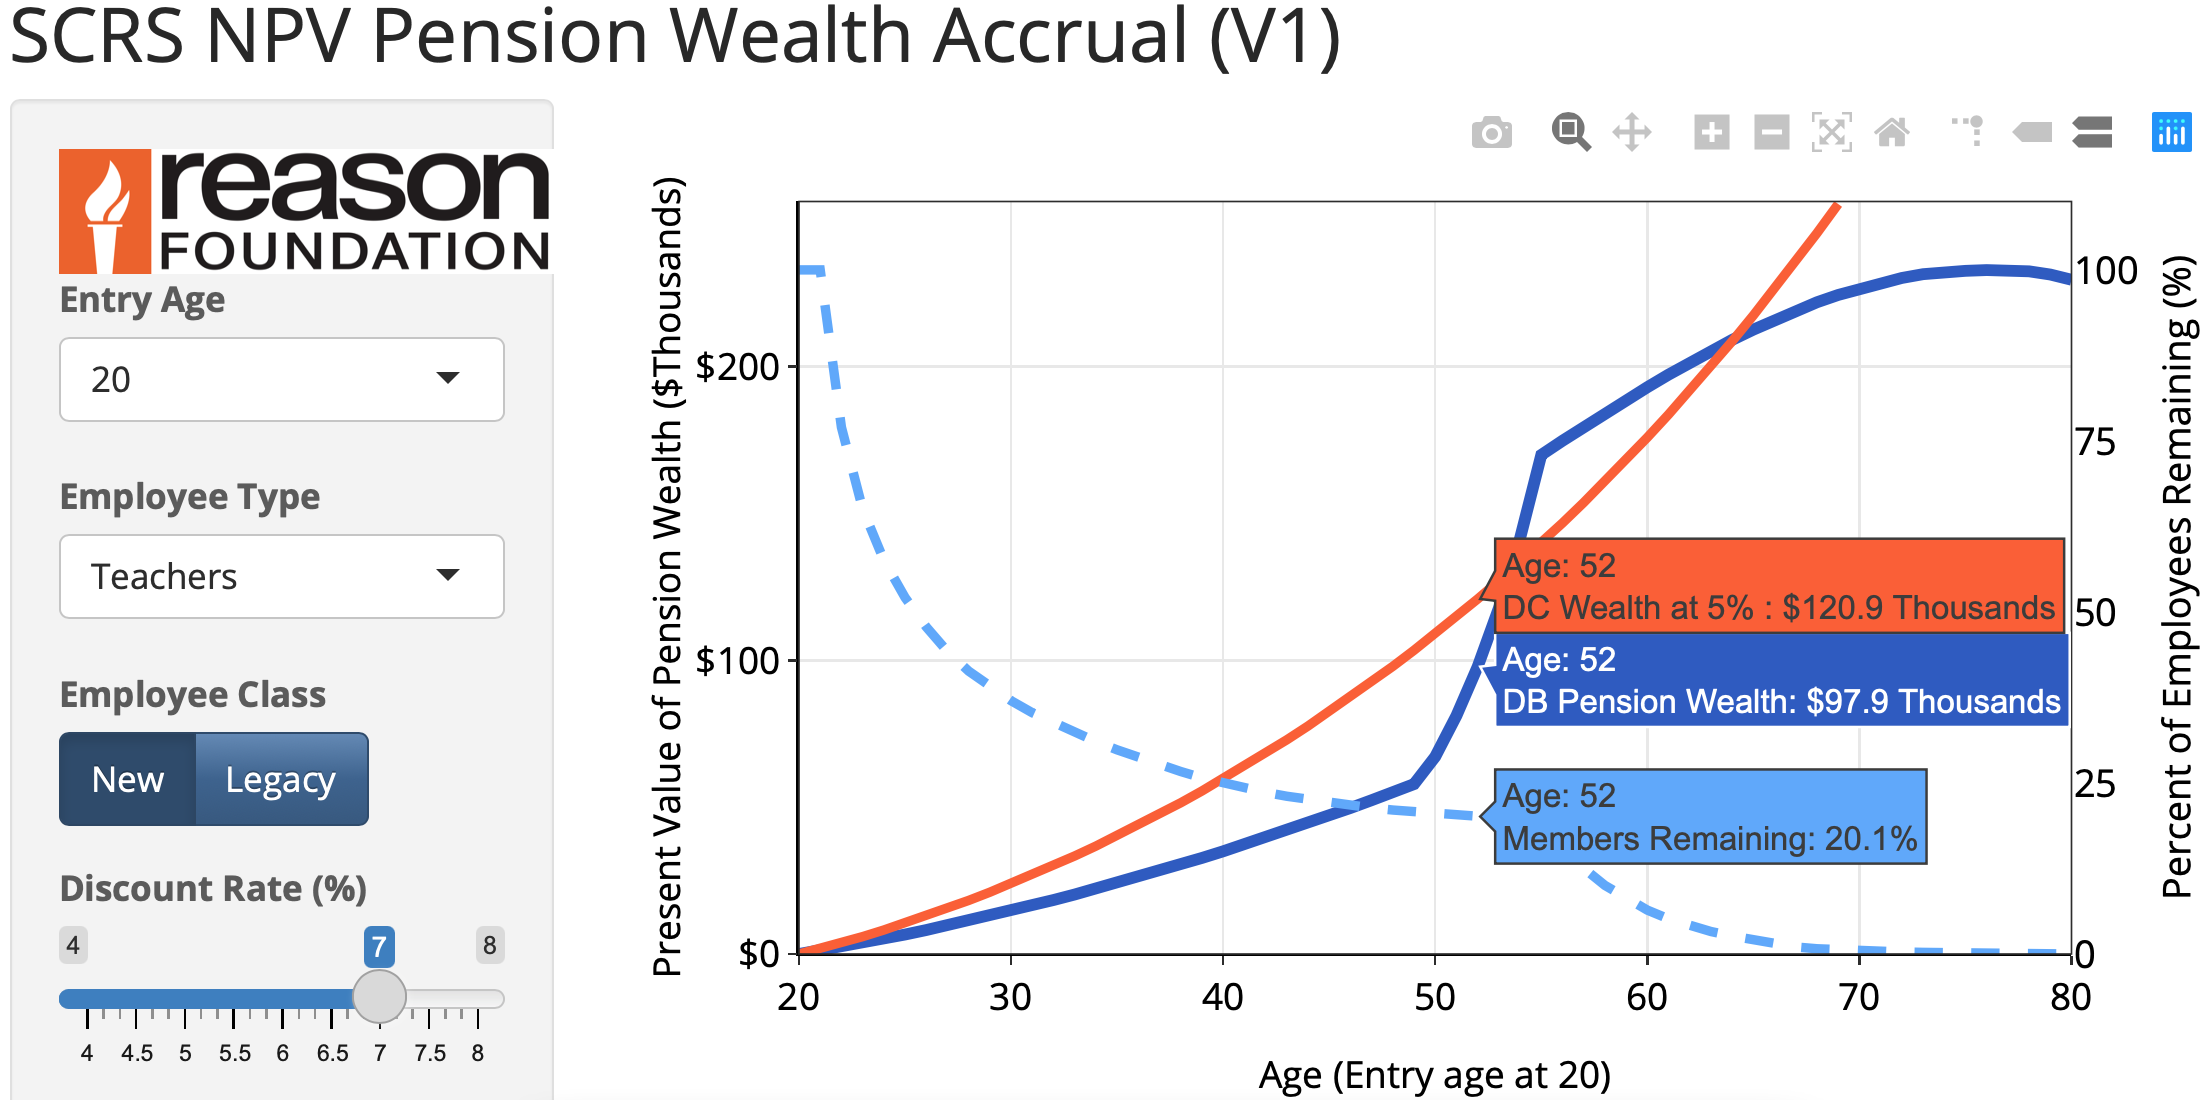
Pension Benefit Projection (App w/ R + Shiny)
– Benefit model (w/ interactive interface and custom R funcitons) that allows to recalculate total present value of public employees’ pension benefits.
Functionality includes Defined Contribution plans benefits, different employee tiers, custom discount rates and other
Pension Benefit Model (Interactive Doc w/ RMarkdown + Shiny)
– RMarkdown document w/ interactive Benefit model elements that allows to write text, bullet points, automate numbers, and interact w/ benefit model.
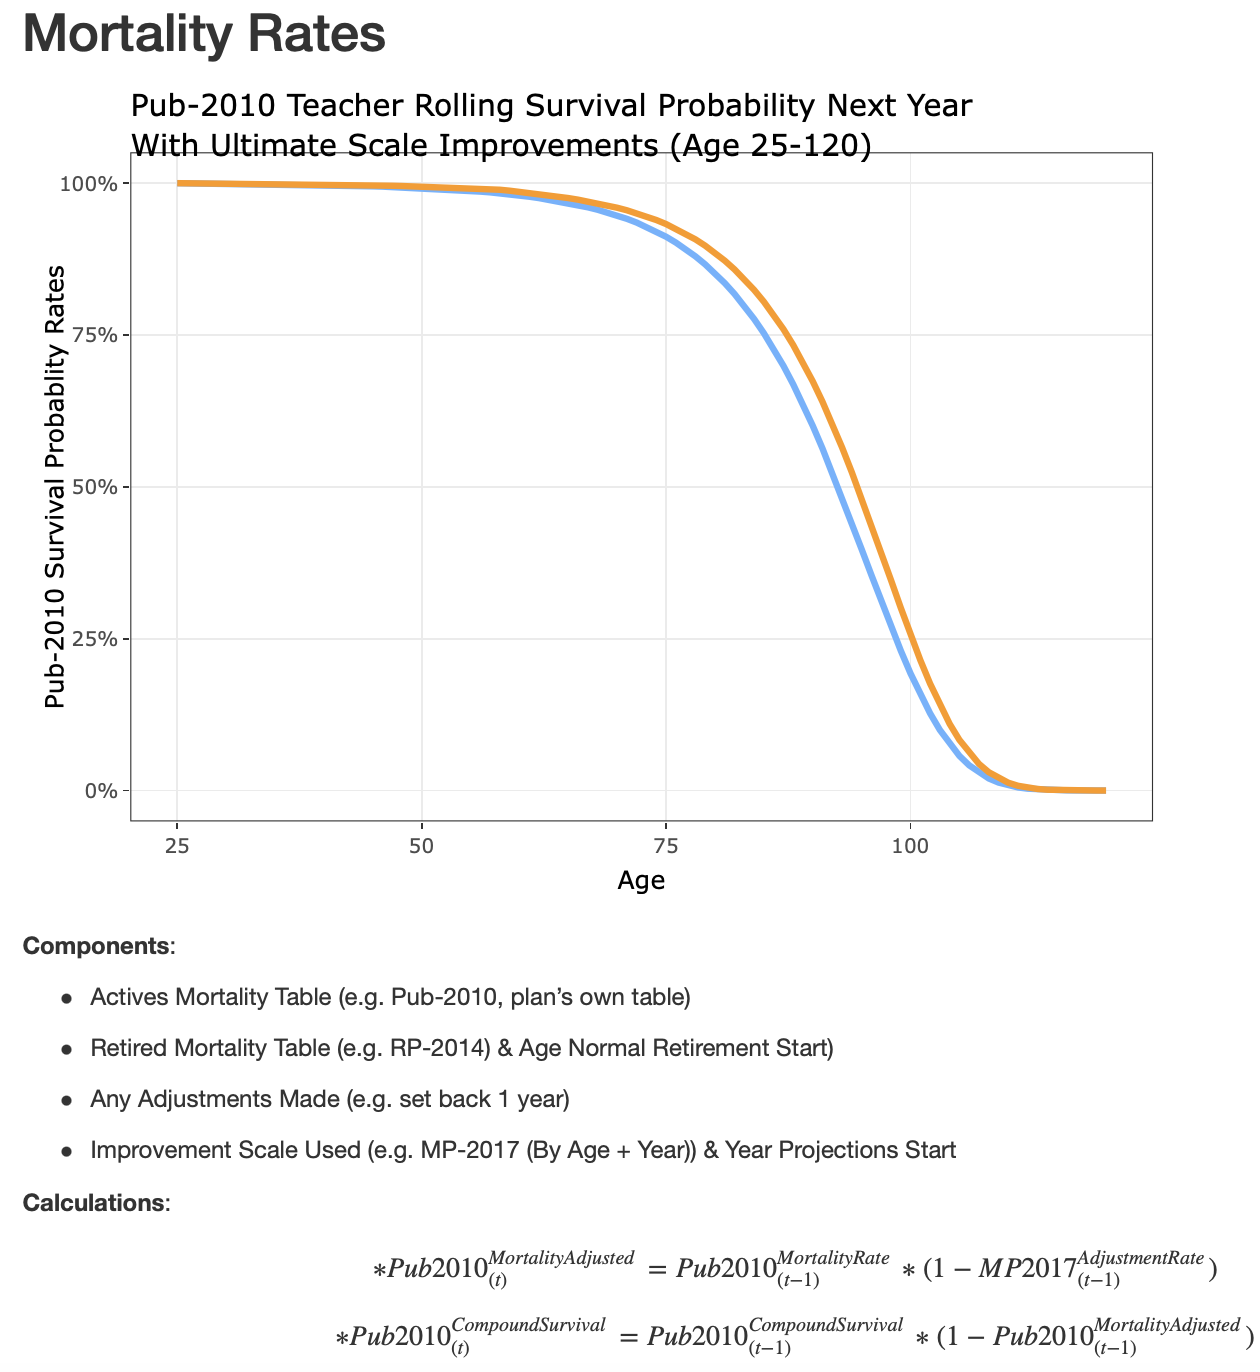
Pension Actuarial Model (Interactive R Shiny)
– R code (with for-loops and custom functions) that projects pension plan’s funding and contributions. Functionality includes stress-testing, changing parameters and amortization method.
Academic Analysis (ML & Probability & Research)
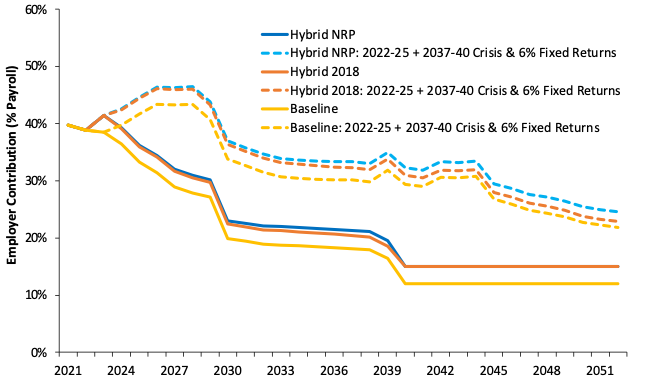
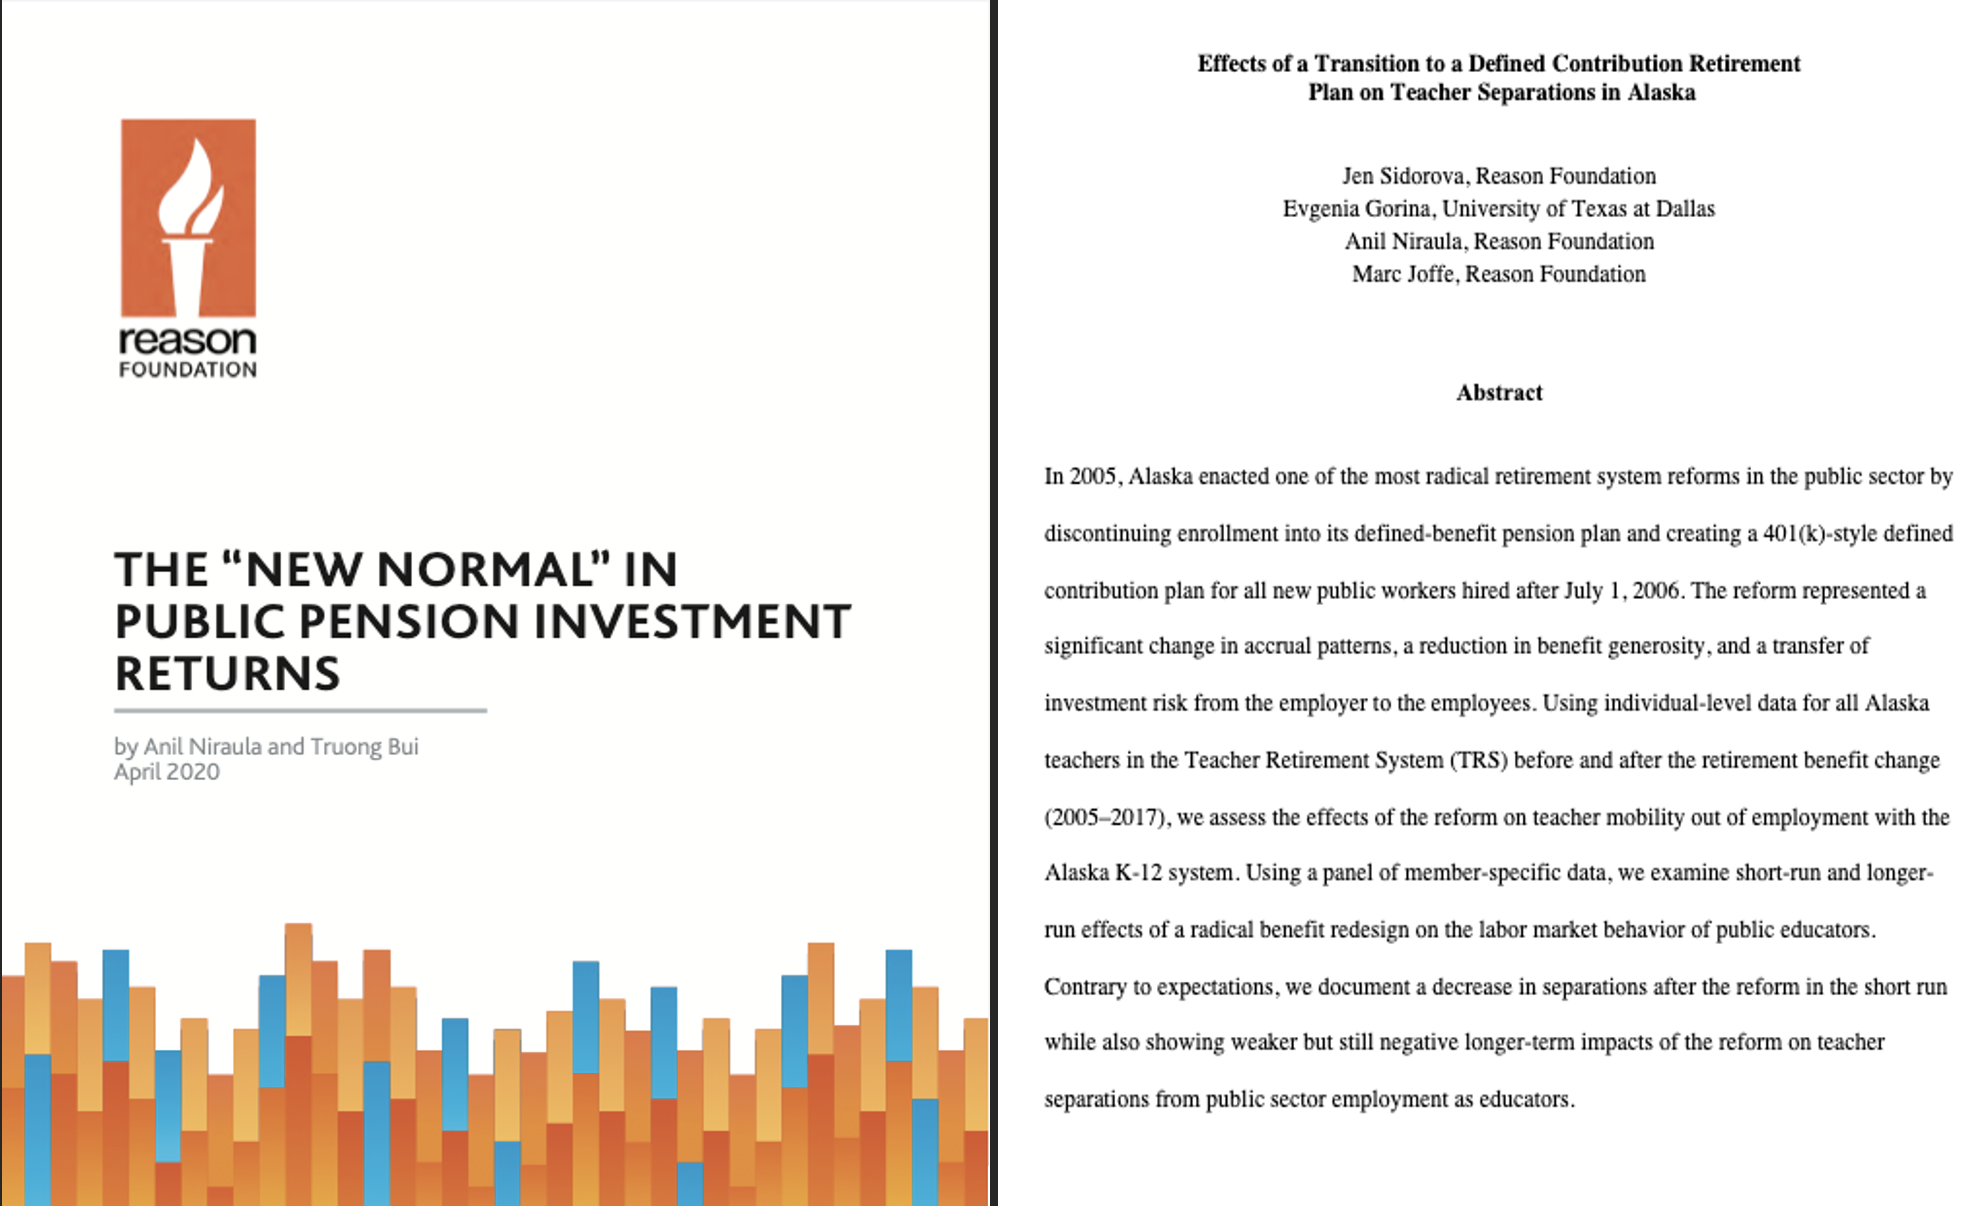
New Normal in Investment Returns (w/ Excel & R)
Alaska TRS Employee Separation Effects (w/ R & Stata)
*– Peer-reviewed academic research and analysis involving data collection and ID joints, descriptive and regression (ML) analysis, probability analysis (Monte Carlo simulations), etc. *
Page template forked from evanca